

In my post “OutOfMemoryError: Java Heap Dump Analysis – What To Do? When Production Goes Crazy!” I mentioned a number of tools you can use to monitor a Java application. VisualVM and JConsole are excellent tools that give a software engineer insight into a single running application.
VisualVM does let you take snapshots of application metrics, such as memory consumption and CPU usage, but you have to create those snapshots manually; if you don’t, all the data is gone as soon as you close VisualVM. In addition, VisualVM has to keep running the whole time, in parallel with the application, in order to record data. If VisualVM isn’t running at a given moment, then of course no data is collected either. In modern web architectures you usually don’t have just a single application server, and when it comes to monitoring and recording an entire cluster, VisualVM is only of limited use — at that point you quickly end up needing commercial solutions like AppDynamics or NewRelic.

Figure 1: VisualVM – runtime metrics during a load test
Another problem is that it’s hard to correlate runtime metrics with log data, because in most companies different problems are handled by different tools — for example NewRelic for recording an application’s runtime metrics and Splunk for log file analysis. So you constantly have to jump back and forth between the different software solutions, and you’re on your own when it comes to keeping the time settings synchronized between both applications, which gets tedious once you’re doing more complex time series analysis. As a result it can be difficult to relate the access log to a rise in memory usage or CPU load. Especially when a java.lang.OutOfMemoryError suddenly shows up, it would be nice to be able to correlate runtime metrics with activity on the website.
From this, the following functional requirements emerge for a software solution for runtime monitoring of an application:
- An application’s runtime data should be collected continuously and automatically,
- Log data should likewise be collected continuously and automatically,
- It must be possible to correlate runtime data and log data from multiple servers.
In my last post, “Splunk – Homebrew Edition with Elasticsearch, Logstash and Kibana (ELK Stack)”, I introduced the ELK stack as a way to collect and analyze log data. With Kibana, the collected log data is visualized and analyzed. An interesting question now is: can the ELK stack also be used to monitor your Java application? If so, all three requirements for a runtime-monitoring software solution would be satisfied in one go.
This post answers the question of whether the ELK stack can also be used to monitor Java applications, by building a simple Java profiler based on the ELK stack. The goal is to monitor memory consumption of an application server cluster with the ELK stack and to be able to correlate it with log data. So let’s first look at what options exist within the Java runtime environment for measuring the runtime behavior of software.
so true! just great! “@theagilepirate: Genius at #xp2014 lightning talks. No further comment needed 😀 pic.twitter.com/mA8v57eBwx”
— Uwe Friedrichsen (@ufried) 28. Mai 2014
Java Profiling
Profilers are tools that let you analyze the runtime behavior of software. There are various problem areas in software development caused by inefficient programming. By analyzing and comparing running programs, a profiler helps a software engineer uncover these different problem areas. From that you can derive measures to structurally and algorithmically improve the source code. For example, the goal of profiling might be tracking down performance bottlenecks or a memory leak, which then need to be eliminated.
The JVM is the part of the Java runtime environment responsible for executing bytecode. During bytecode execution, there are certain runtime metrics that can be measured. Examples of runtime metrics are memory consumption, the number of running threads, or CPU usage.
Figure 2 shows the Java memory architecture of Oracle HotSpot‘s JVM implementation, along with the JVM parameters you can use to influence memory management. Young Generation and Old Generation together make up the heap. Alongside that sits the Permanent Generation, which since JDK 8 has also been called Metaspace. Memory can run out in any of these areas, since they are, after all, a physically limited resource. If the heap or the metaspace runs out of memory, you get the so-called OutOfMemoryError.
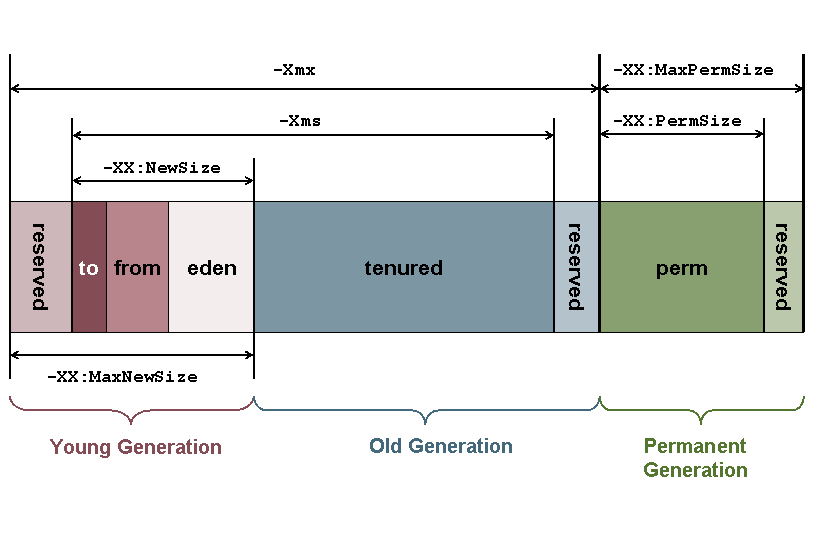
In the Java world there are two specifications that, among other things, deal with monitoring the Java memory architecture: JSR-174: Monitoring and Management Specification for the Java Virtual Machine and JSR-163: Java Platform Profiling Architecture. JSR-174 defines requirements for a JVM monitoring and management system. JSR-163 not only defines interfaces needed by JSR-174, but also provides reference implementations and test tools for monitoring, remote-controlling, and measuring Java applications. Since JDK 5, both JSRs have been integrated into the runtime environment (source). Examples of an interface and reference implementation for monitoring the Java memory architecture are the interface java.lang.management.MemoryPoolMXBean and the class java.lang.management.MemoryUsage.
The JVM has automatic memory management and uses the heap to allocate new objects, which in turn is made up of several memory areas. In addition, the JVM has what’s known as Non-Heap memory, where the so-called Method Area resides, which contains the loaded classes. This results in multiple memory pools. An instance of the management interface MemoryPoolMXBean therefore always represents one specific memory pool, such as Old Generation or Eden Space. In the Oracle HotSpot implementation you’ll find all the memory pools shown in Figure 2. All instances (sun.management.MemoryPoolImpl) of the different memory pools can be accessed via ManagementFactory.getMemoryPoolMXBeans().
The method getUsage() gives you the estimated memory size of the current memory pool. For a memory pool that’s cleaned up by a garbage collector, this size includes both reachable and unreachable objects.
The MemoryUsage class contains the following four values:
| Wert | Beschreibung |
|---|---|
| init | repräsentiert die initiale Speichermenge in bytes, die während des Startvorgangs der JVM allokiert wird. Dieser Wert kann auch undefined sein. |
| used | repräsentiert den aktuellen Speicherverbrauch in bytes. |
| committed | repräsentiert den maximalen Speicherverbrauch, der von der JVM ohne Speicherumstrukturierung garantiert wird. Dieser Wert kann sich über die Laufzeit hinweg ändern. |
| max | repräsentiert maximalen Speicherverbrauch, der von der JVM allokiert werden kann. |
Similar management beans exist for querying other runtime metrics as well, such as the number of running threads or loaded classes. Runtime metrics not covered by the java.lang.management API can be implemented yourself. For that, there’s the java.lang.instrument API, which, for example, also makes it possible to measure a method’s execution time by modifying a class’s bytecode. For that you use what’s called a Java agent. This API is the foundation for many commercial profilers and is typically shipped as a JAR file. The following listing shows a Java agent and how you can rewrite a class’s bytecode with Javassist so that the execution time of a method is printed to the console after every method call:
public class AppStashAgent {
    public static void premain(String agentArguments, Instrumentation instrumentation) {
         instrumentation.addTransformer(new ClassFileTransformer() {
            @Override
            public byte[] transform(ClassLoader loader, String className, Class<?> classBeingRedefined, ProtectionDomain protectionDomain, byte[] classfileBuffer) throws IllegalClassFormatException {
                byte[] result = new byte[0];

                try {
                    String dotClassName = className.replace('/', '.');

                    ClassPool cp = ClassPool.getDefault();
                    CtClass ctClazz = cp.get(dotClassName);

                    for (CtMethod method1 : ctClazz.getDeclaredMethods()) {
                        method1.addLocalVariable("elapsedTime", CtClass.longType);

                        method1.insertBefore("elapsedTime = System.nanoTime();");
                        method1.insertAfter(" { elapsedTime = System.nanoTime() - elapsedTime; "
                                + "System.out.println(" Method elapsedTime = " + elapsedTime);}");
                        result = ctClazz.toBytecode();

                    }

                } catch (Throwable e) {
                    e.printStackTrace();
                }
                return result;
            }
        });
    }
}
Most Java profilers give you a detailed view into an application. But it can happen that you simply can’t use a particular profiler in production. That’s often because the profiler uses either the Java Virtual Machine Profiling Interface (JVMPI) or the Java Virtual Machine Tool Interface (JVMTI) to collect its data. Using JVMPI or JVMTI can slow down the application’s execution time.
In that case, the mere presence of an agent forces the entire bytecode of a class to always be loaded from disk, because the bytecode gets modified after the class is loaded. In order to still be able to use such a profiler, you have to go to the effort of simulating production-like load scenarios with load-testing tools such as JMeter or Gatling.
An alternative to classic profiling is manually measuring execution time in the source code and writing it to a log file. Depending on the size of the development team and the application, that can quickly turn into a maintenance nightmare, since you end up polluting the source code with measurement code. To avoid polluting the source code, frameworks like JETM exist. Let’s take a look at JETM below to get a better understanding of what options and concepts exist for measuring an application as an alternative to using an agent.
Java Execution Time Measurement Library (JETM)
With the Java Execution Time Measurement Library (JETM), a software engineer can measure the execution speed of their application down to the method level. In a Spring application, JETM can even measure execution speed without touching a single line of source code. In that case, JETM uses Spring AOP and generates dynamic proxies to measure the Spring beans. JETM is very easy to use — you just need to put the JETM JARs on the classpath and adjust the application’s configuration accordingly. The following listing shows what you need to configure in a web application’s web.xml to measure individual requests of an application with JETM.
<servlet>
    <servlet-name>performanceMonitor</servlet-name>
    <servlet-class>etm.contrib.integration.spring.web.SpringHttpConsoleServlet</servlet-class>
    <load-on-startup>1</load-on-startup>
</servlet>
<servlet-mapping>
    <servlet-name>performanceMonitor</servlet-name>
    <url-pattern>/performance/*</url-pattern>
</servlet-mapping>

<filter>
    <filter-name>performance-monitor</filter-name>
    <filter-class>
      etm.contrib.integration.spring.web.SpringHttpRequestPerformanceFilter
    </filter-class>
</filter>

<filter-mapping>
    <filter-name>performance-monitor</filter-name>
    <url-pattern>*</url-pattern>
</filter-mapping>
The so-called JETM Console makes the measurement results available. Figure 3 shows a screenshot of the JETM console. You can integrate the JETM console into an existing web application via a servlet, or use a standalone HTTP console server. That means JETM can be used both for macrobenchmarks and microbenchmarks.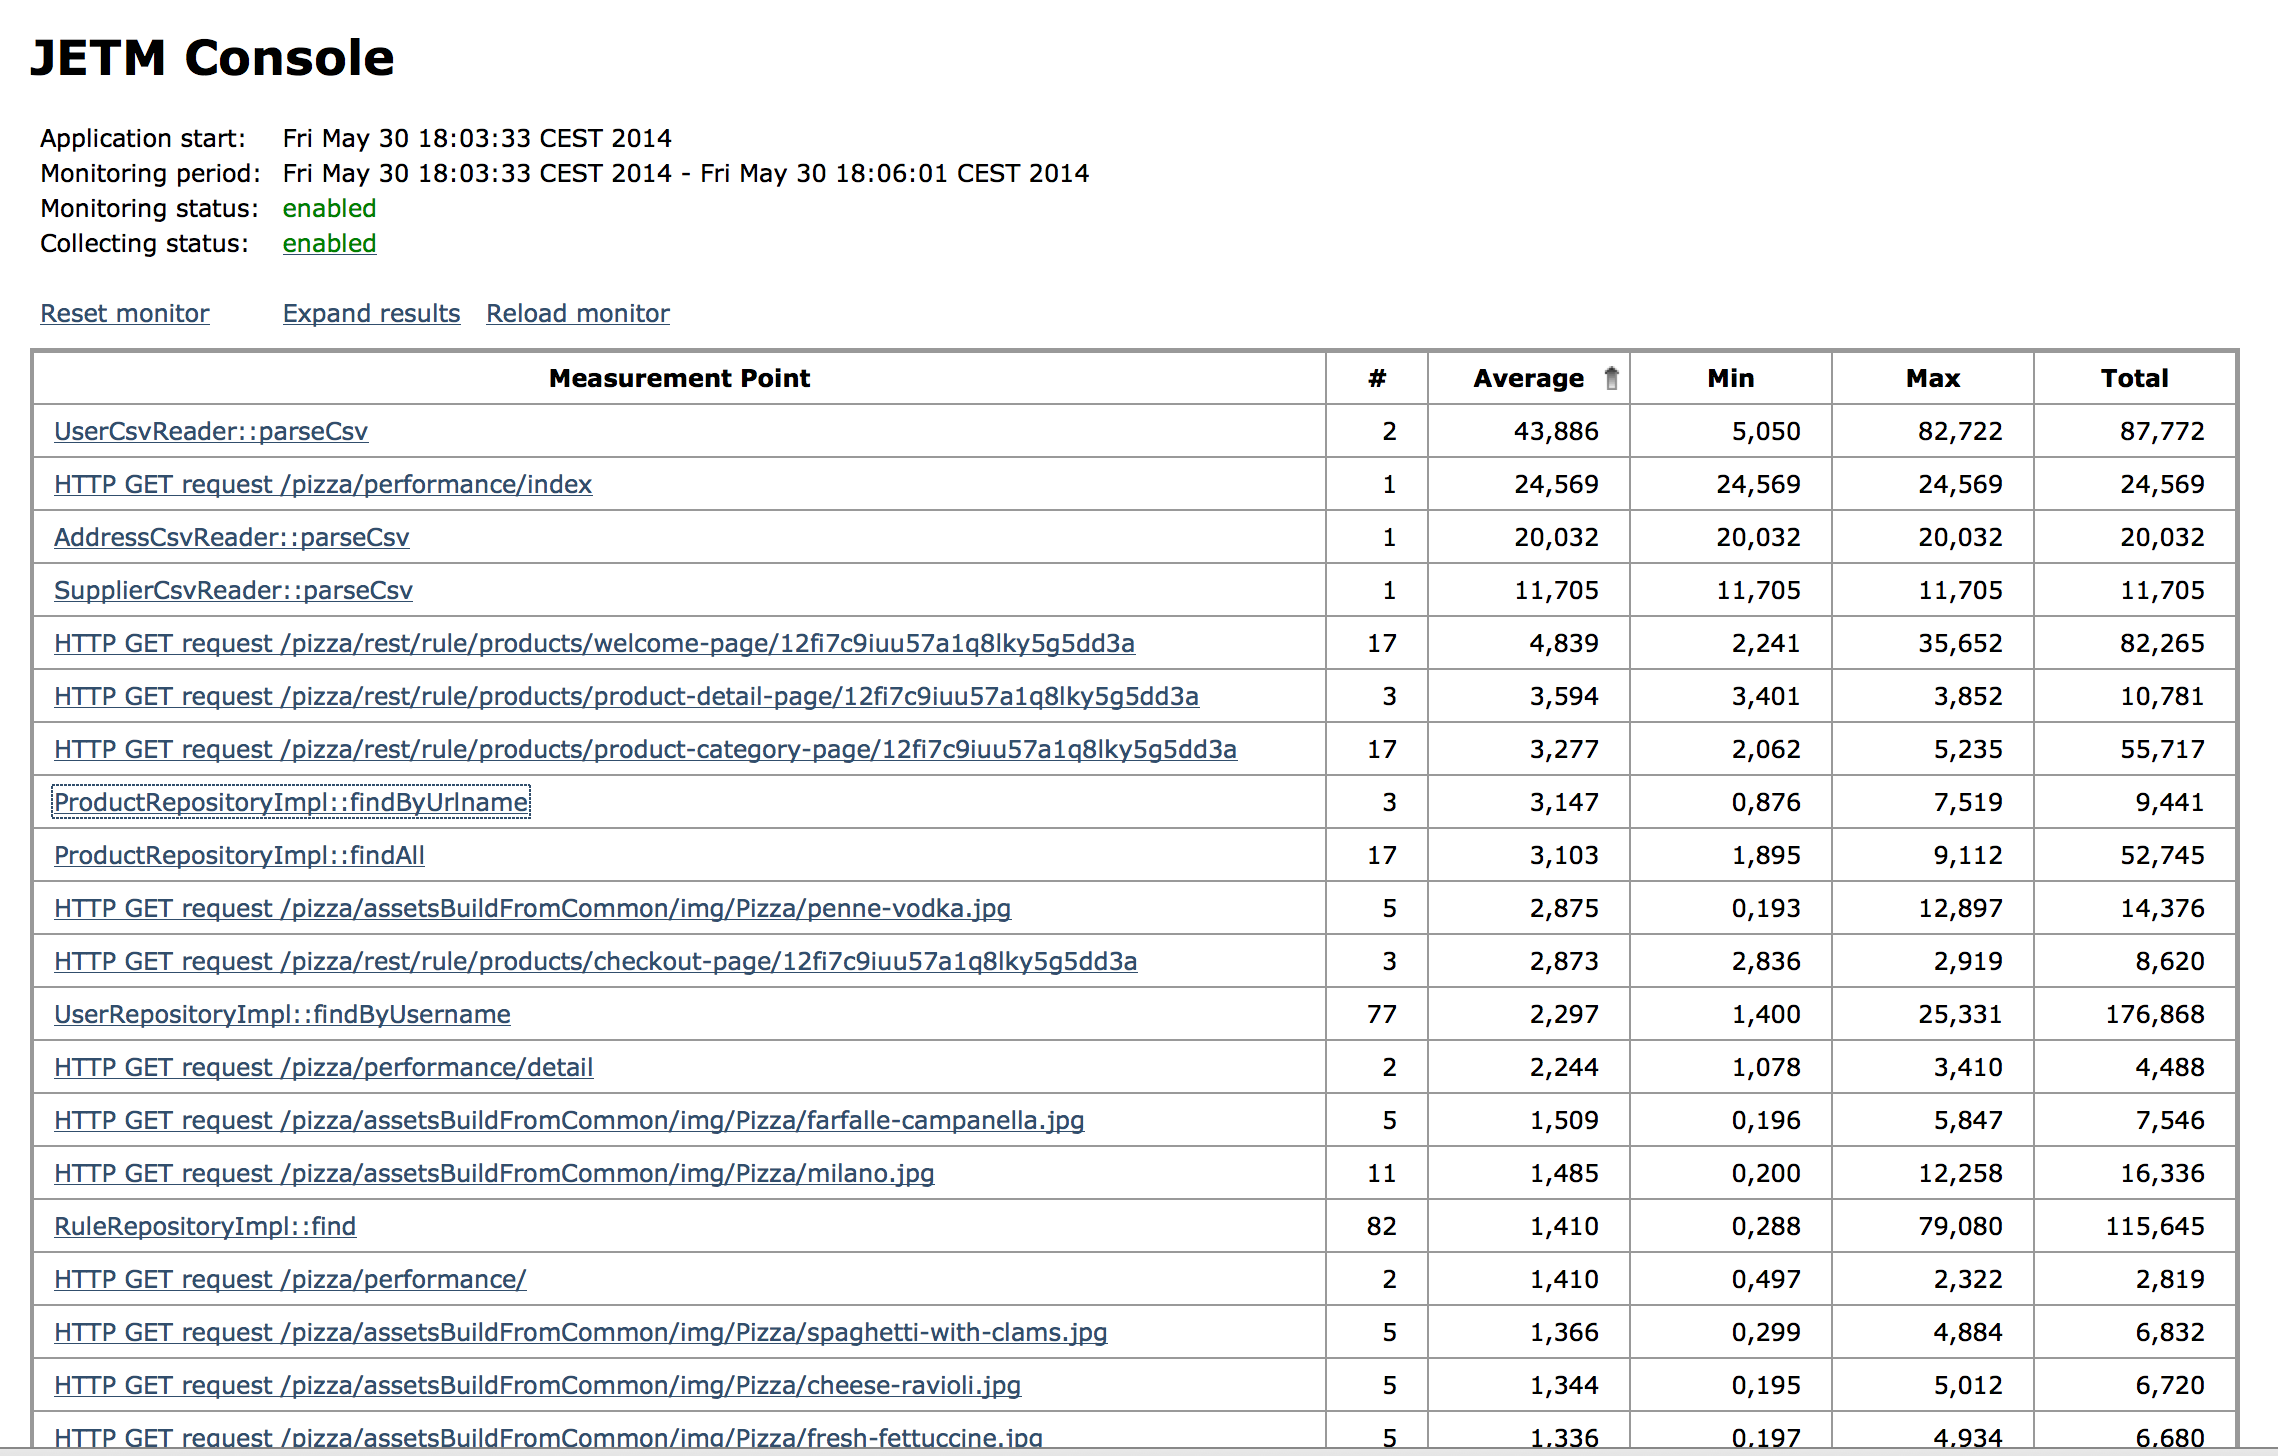
Figure 3: JETM Console
From these considerations about the java.lang.management, java.lang.instrument API and JETM, two more non-functional requirements emerge for a software solution for runtime monitoring of a Java application:
- Runtime data must also be collectible in production,
- Collecting runtime metrics should be enabled via configuration.
Let’s now look at how we can build a Minimum Viable Product of a runtime monitoring software solution from the functional and non-functional requirements we’ve defined.
A Profiler Built on the ELK Stack
As already mentioned, the following functional and non-functional requirements emerge for a software solution for runtime monitoring of an application:
- An application’s runtime data should be collected continuously and automatically,
- Log data should likewise be collected continuously and automatically,
- It must be possible to correlate runtime data and log data from multiple servers,
- Runtime data must also be collectible in production,
- Collecting runtime metrics should be enabled via configuration.
The ELK stack makes it possible to collect log data automatically and consists of the following components:
- Elasticsearch – for search and data analysis,
- Logstash – for centralizing, enriching and parsing log data,
- Kibana – for data visualization.
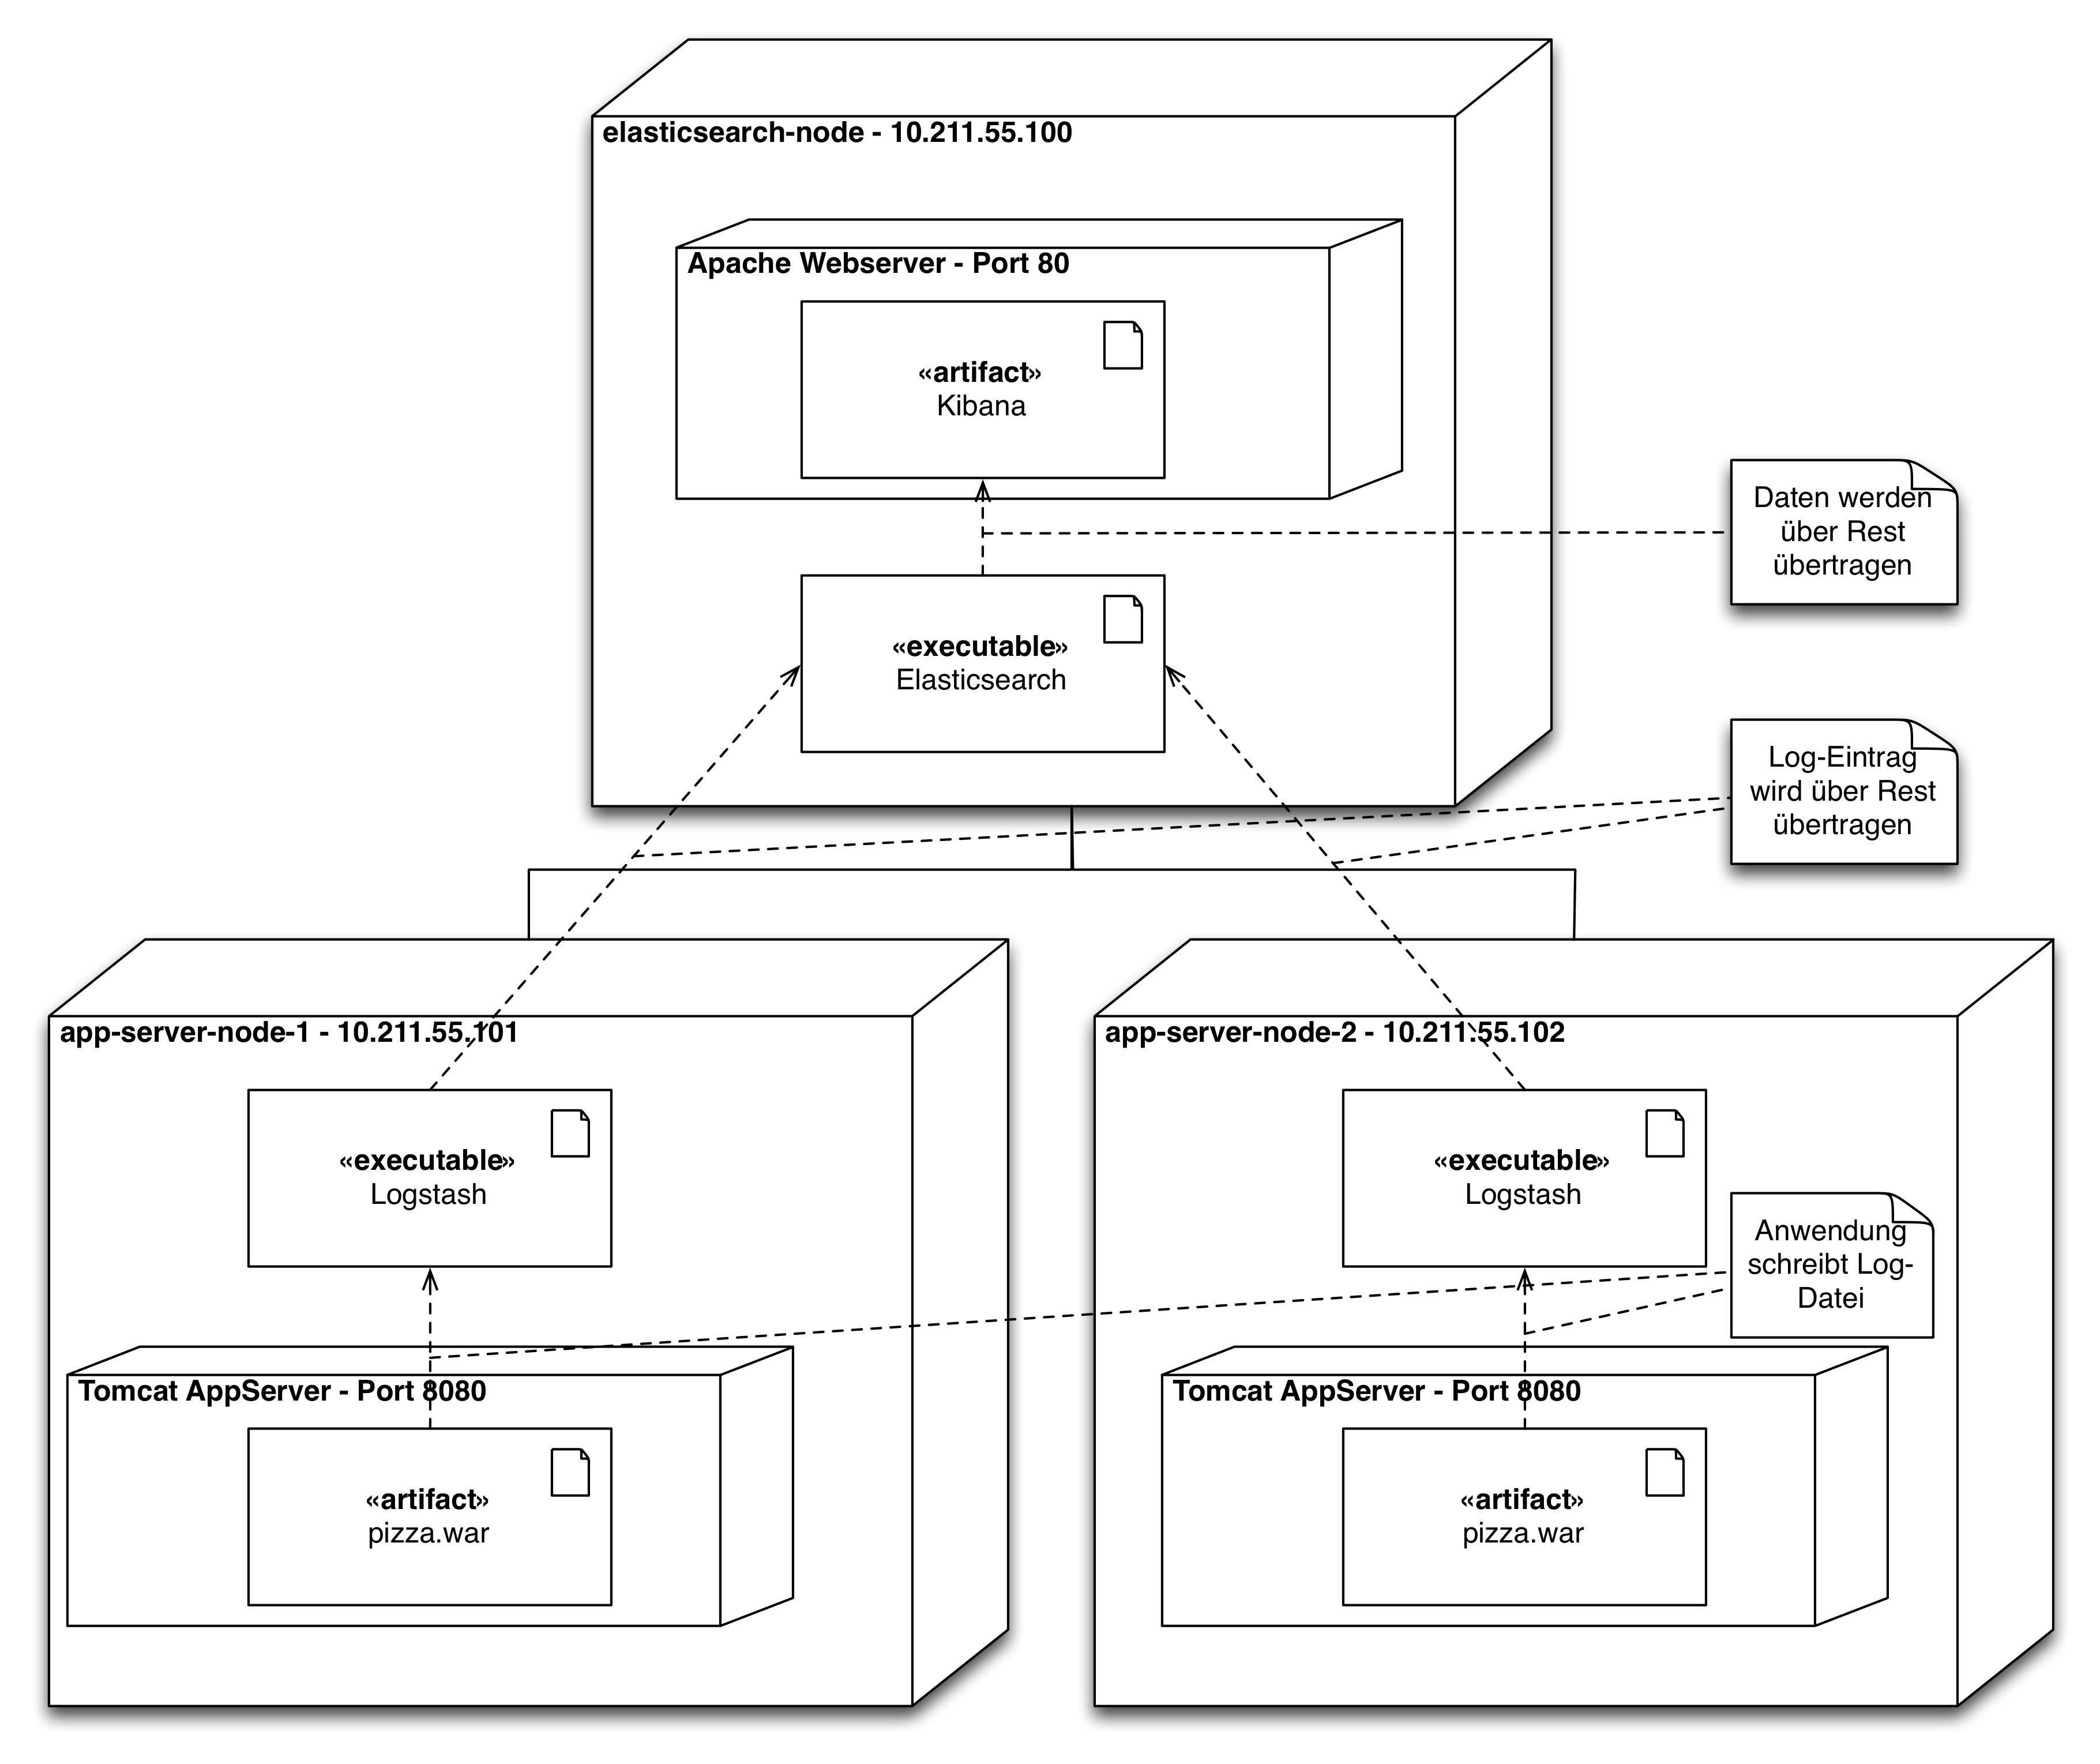
Figure 4 shows one possible architectural setup of an ELK cluster. The cluster consists of three machines. Two of the machines have Tomcat application servers installed on them. The Tomcat application servers continuously write log data. For that reason, Logstash is also installed on these two machines. In this setup, Logstash acts as an ETL tool, extracting the log data, transforming it where necessary, so that the log data can be written into Elasticsearch and indexed by Elasticsearch. A third machine has an Apache web server installed, which serves as the web directory for Kibana, and which visualizes the log data collected by Logstash from both Tomcat application servers. For visualization, Kibana uses Elasticsearch’s REST API.
Log = Timestamp + Data
An application’s log data always consists of a timestamp plus some data. Our application’s runtime metrics have a similar structure. At a given point in time, the application is consuming a certain amount of memory.
You can think of the JVM as a real machine equipped with sensors, and these sensors can be polled periodically for monitoring purposes. One such sensor is, for example, a MemoryPoolMXBean instance. If you bring this sensor data into a form that also carries a timestamp and write it to a file, the log data can be processed by Logstash and fed into Elasticsearch. The following listing shows a possible JSON structure for our memory sensor:
{
    "name": "PS Old Gen",
    "type": "Heap memory",
    "@timestamp": "2014-05-28T23:43:19",
    "@version": "1",
    "init": 266862592,
    "used": 2417592,
    "committed": 266862592,
    "max": 2863661056
}
With that, the ELK stack is already capable of fulfilling our functional requirements for a runtime-monitoring software solution. But we also defined non-functional requirements — among other things, the runtime metrics should also be collectible in production, and collection should be started via configuration. To collect runtime metrics decoupled from the rest of the application, a Runnable is a good fit. A Runnable can be run continuously in the background of the application via a ScheduledThreadPoolExecutor, continuously collecting runtime metrics. The ScheduledThreadPoolExecutor can easily be configured with Spring, as we’ll see shortly. The following listing shows how you can dump the MemoryUsage values of the various MemoryPoolMXBeans to the console in JSON format:
public class MemoryLoggingTask implements Runnable {
    private static final Logger LOGGER = LoggerFactory.getLogger(MemoryLoggingTask.class);
    private static final ObjectMapper OBJECT_MAPPER = new ObjectMapper();

    @Override
    public void run() {
        for (MemoryPoolMXBean memoryPoolMXBean : ManagementFactory.getMemoryPoolMXBeans()) {
            try {
                String message = memoryUsageAsJsonString(memoryPoolMXBean);
                LOGGER.info(message);
            } catch (IOException e) {
                LOGGER.error("Object could not converted to JSON String:", e);
            }
        }
    }

    private String memoryUsageAsJsonString(MemoryPoolMXBean memoryPoolMXBean) throws IOException {
        return OBJECT_MAPPER.writeValueAsString(buildMemoryUsageInfo(memoryPoolMXBean));
    }

    private MemoryUsageInfo buildMemoryUsageInfo(MemoryPoolMXBean memoryPoolMXBean) {
        return MemoryUsageInfo.builder()
                .name(memoryPoolMXBean.getName())
                .type(memoryPoolMXBean.getType().toString())
                .usage(memoryPoolMXBean.getUsage())
                .build();
    }
}
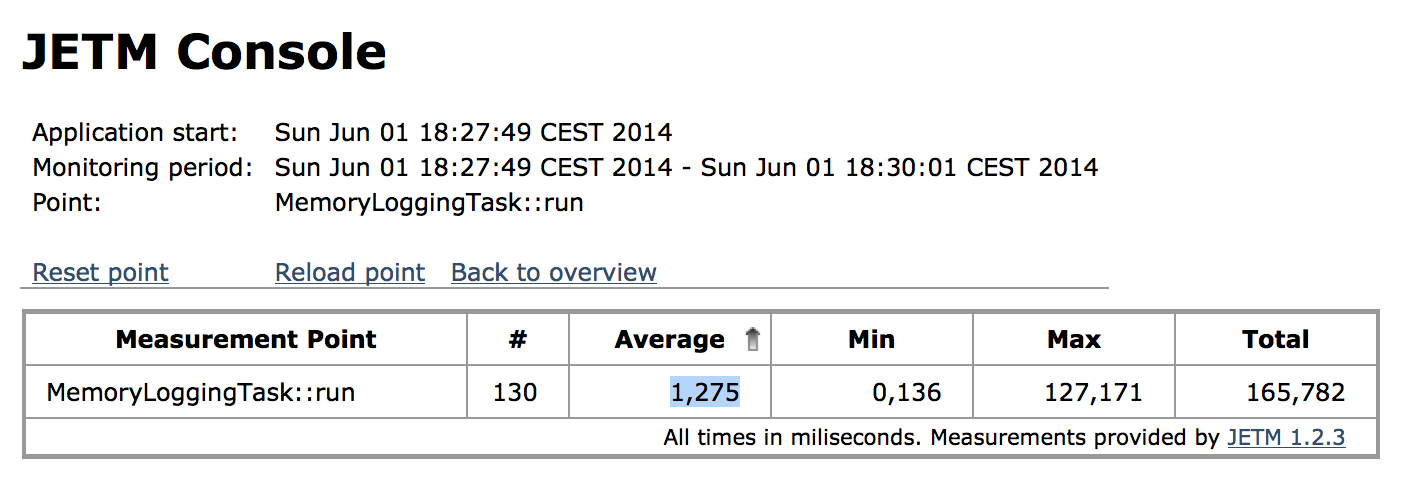
The question now is: is our MemoryLoggingTask fast enough for production use? Figure 5 shows a microbenchmark of the run method, recorded with JETM. The method was called 130 times, and on average the execution time was 1ms. What you can’t see in the figure is that the maximum value occurred on the very first call. For every subsequent call, execution took around 150ns. So there’s nothing standing in the way of using MemoryLoggingTask in production.
The last non-functional requirement is that collecting runtime metrics should be startable via configuration. As already mentioned, it’s very easy with Spring to let our MemoryLoggingTask run in the background. The following listing shows what you need to do for that.
<bean id="appStashMemoryLogging" class="io.github.appstash.task.MemoryLoggingTask" />

<task:scheduled-tasks scheduler="appStashScheduler">
    <task:scheduled ref="appStashMemoryLogging" method="run" fixed-delay="1000"/>
</task:scheduled-tasks>

<task:scheduler id="appStashScheduler" pool-size="10"/>
Summary
As we’ve seen in this post, you can write your own profiler with the simplest of means. Since runtime metrics can also be viewed as timestamp plus data, you can write that data to a file and visualize it with a log analysis tool. Figure 6 shows the Kibana visualization of heap memory next to VisualVM. You can clearly see the continuous garbage collection of the heap. Of course, you could use the same concept with other log analysis tools, such as Splunk, to produce similar visualizations.
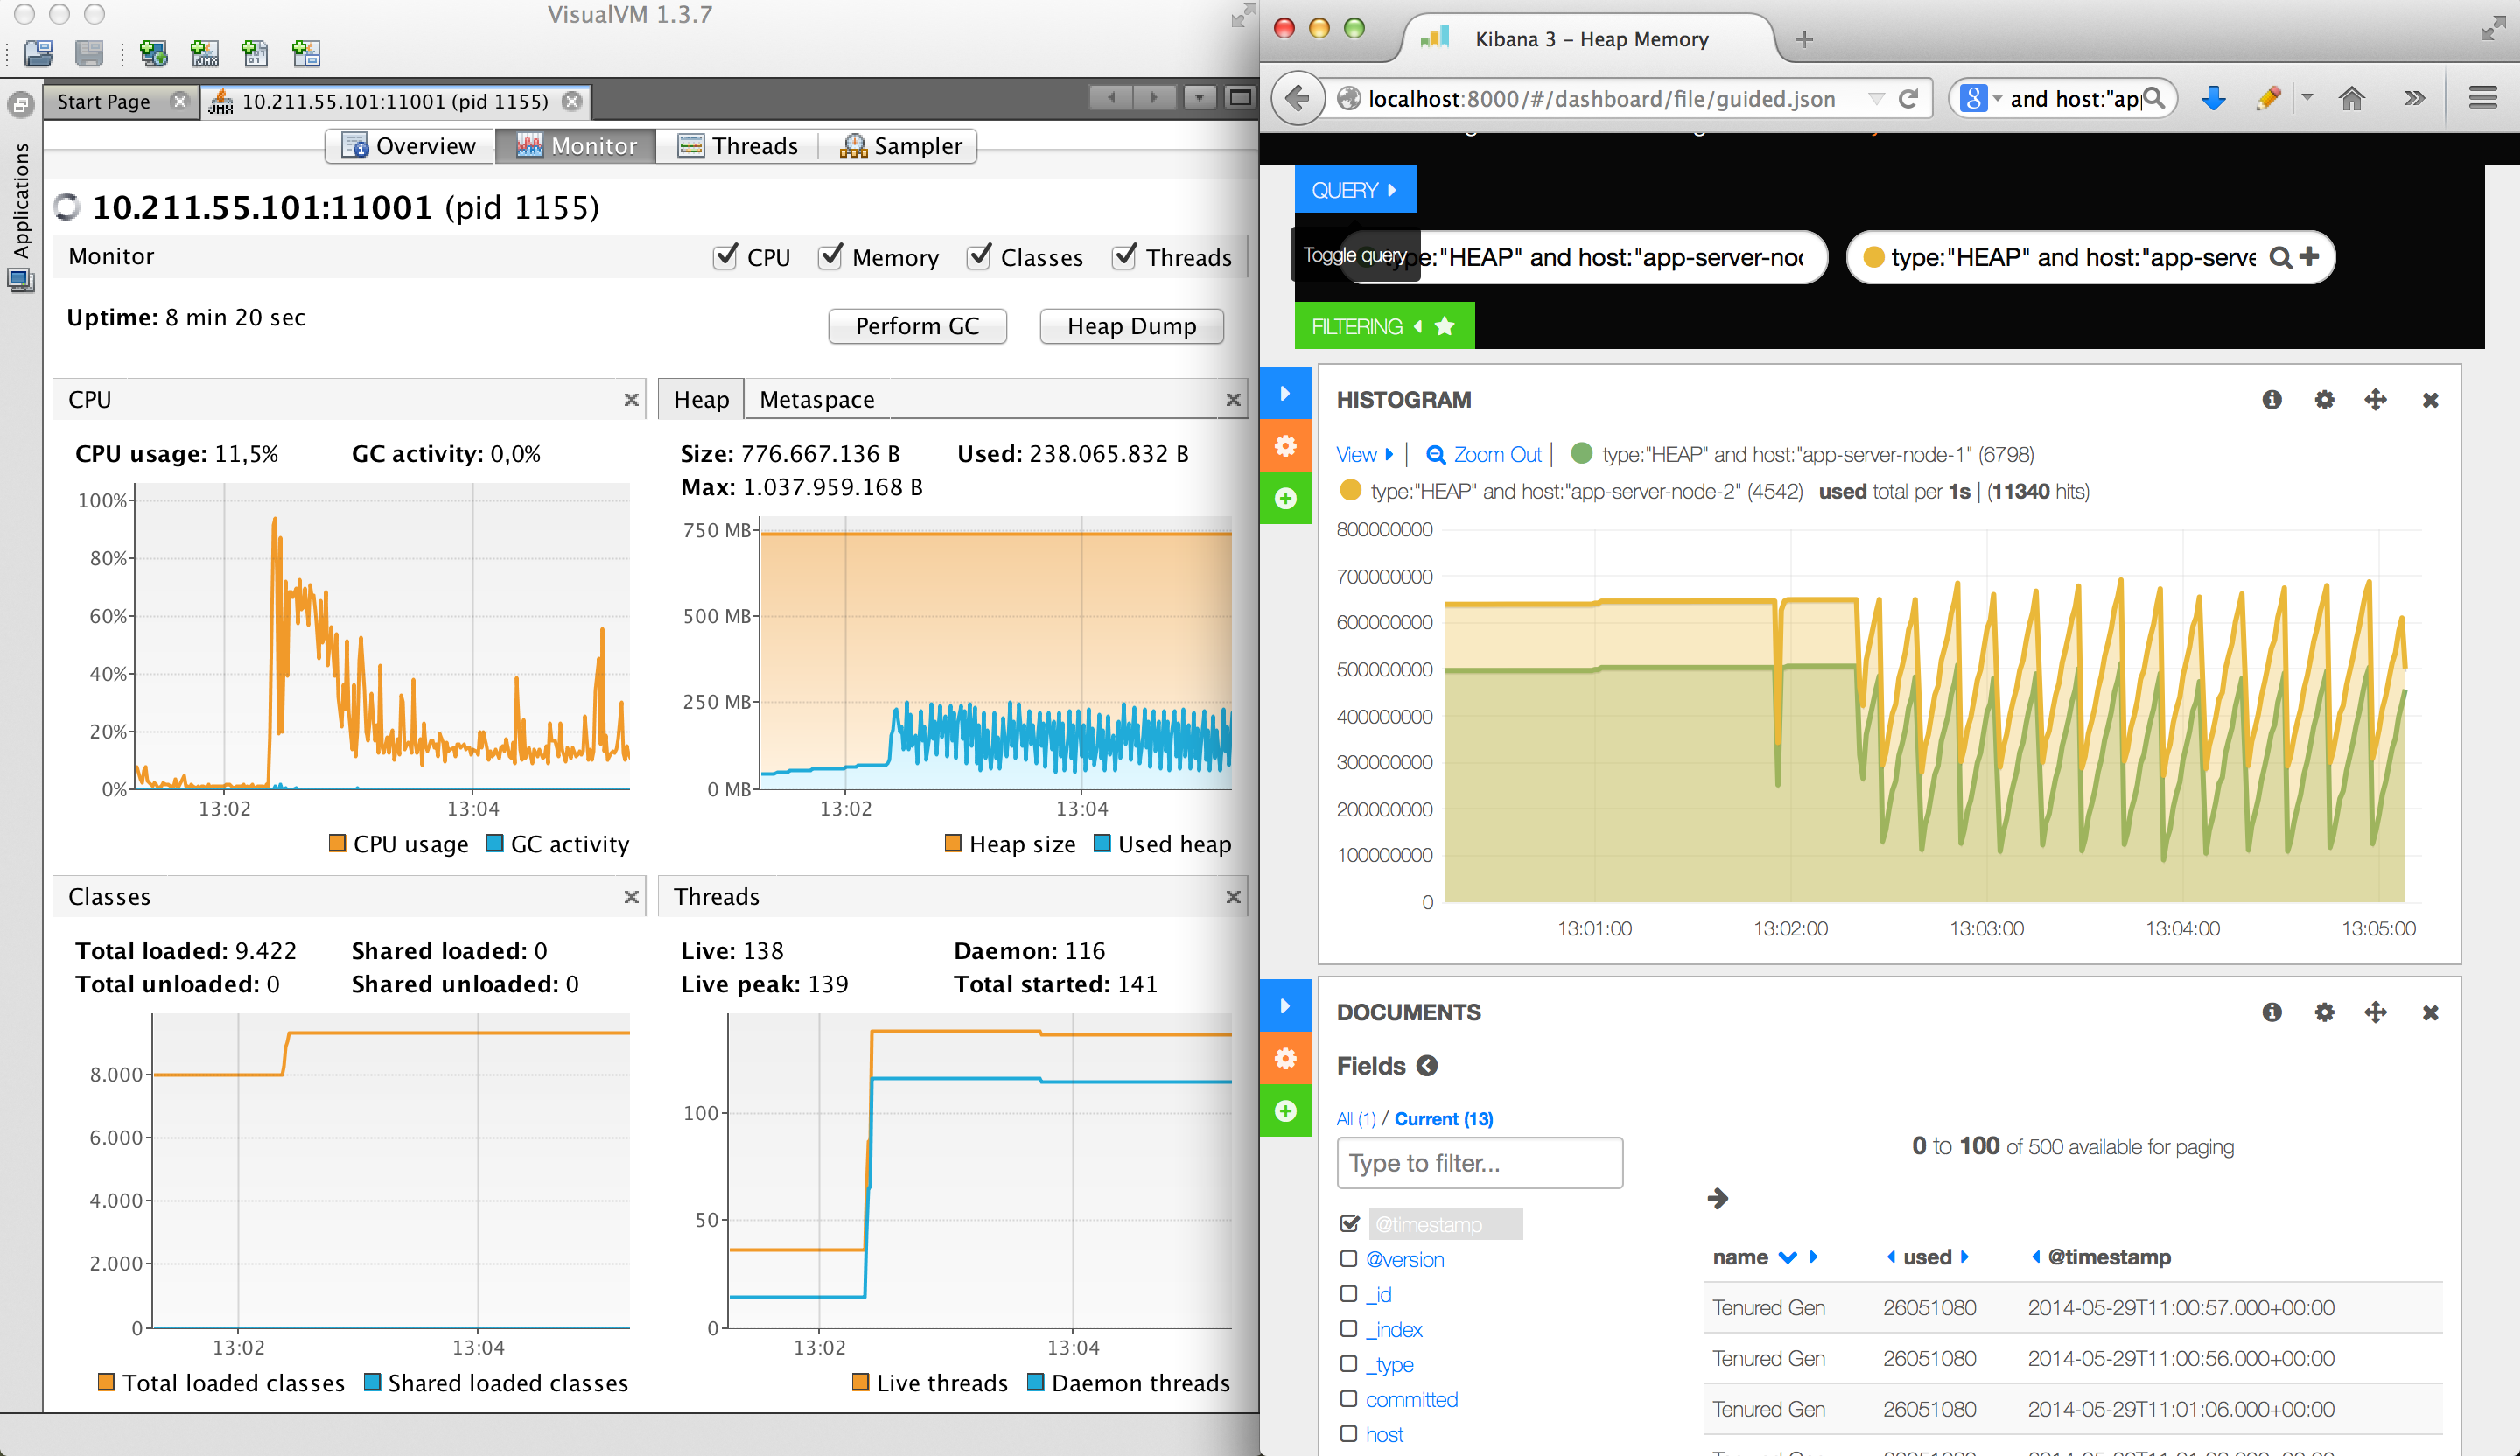
To start up the complete cluster shown in Figure 4, all you need to do is install VirtualBox and Vagrant. After that, you just need to run the following three commands. The dashboard shown in Figure 6 can be found under /appstash/external/Heap Memory Dashboard.
bernd@mbp ~$ git clone https://github.com/zutherb/AppStash.git appstash
bernd@mbp ~$ git checkout elk-example
bernd@mbp ~$ cd appstash/vagrant
bernd@mbp ~$ vagrant up
You can reach the ELK stack components shown in Figure 4 via the following port forwardings:
- Kibana – http://localhost:8000/
- Elasticsearch – http://localhost:9200/
- Application 1 – http://localhost:8080/pizza/
- Application 2 – http://localhost:8081/pizza/
Retrospective (2026)
Looking back, hand-rolling a profiler out of MemoryPoolMXBeans and the ELK stack was a fun exercise, but I wouldn’t recommend it to anyone today — the problem it solves is now handled far better by purpose-built tooling. Prometheus with a JVM exporter gives you the same memory and GC metrics with proper time-series storage and alerting out of the box, Grafana replaces my makeshift Kibana dashboards with something designed for exactly this, and OpenTelemetry has turned “correlate runtime metrics with logs and traces” from a DIY integration problem into a standard, vendor-neutral contract. The core idea I was reaching for back then — one timestamp, one data point, correlate everything — is now just how observability pipelines work by default. What does carry forward is the instinct behind it: build the smallest possible sensor, make it cheap enough to run in production, and feed it into a system built for querying time series rather than grepping logs. That’s exactly the mindset I apply now when instrumenting AI agents, where the “memory pool” has become token usage, tool-call latency and model error rates, and the ELK stack of 2014 has become OpenTelemetry traces flowing into Grafana.