

A root cause analysis rarely has a clean ending. Mine started with an acute memory overload that brought my mini PC to its knees – and ended, after the acute problem was long fixed, with a second, subtler diagnosis: an emergency configuration that had quietly turned into a permanent regression, long after the original incident was over. In between came two false leads, an analysis of over 8,000 log lines, and a reboot that didn’t fix it, even though I expected it to.
- How a classic swap overload took down my local inference server
- Why an emergency configuration built under time pressure became the actual root cause of a performance regression – separate from the incident that triggered it
- How my Hermes agent and I systematically tested and discarded hypotheses instead of guessing
- Why a successful reboot can fix a symptom without touching the root cause
Incident: a swap overload takes down the inference server
My mini PC – a Strix Halo S1 Max that also runs my local inference server Strata – got noticeably sluggish one morning. Load average in the double digits across 32 CPU cores, memory fully committed, swap completely full (8 of 8 GB). Once the swap buffer runs out of headroom, the system spends more time paging memory in and out than doing actual work – classic swap thrashing, no single component is “broken,” the system is simply structurally overcommitted.
Root cause of the incident: several memory-heavy processes had come up at almost the same time – my local LLM Qwen 3.8 Flash Next (a Mixture-of-Experts model, 48 layers) served via Strata, configured with a 256K-token context window and a fixed 40 GB RAM budget for resident model experts, plus a running npm update and the OpenClaw gateway process. Each on its own was harmless; together they were enough to overcommit the available memory.
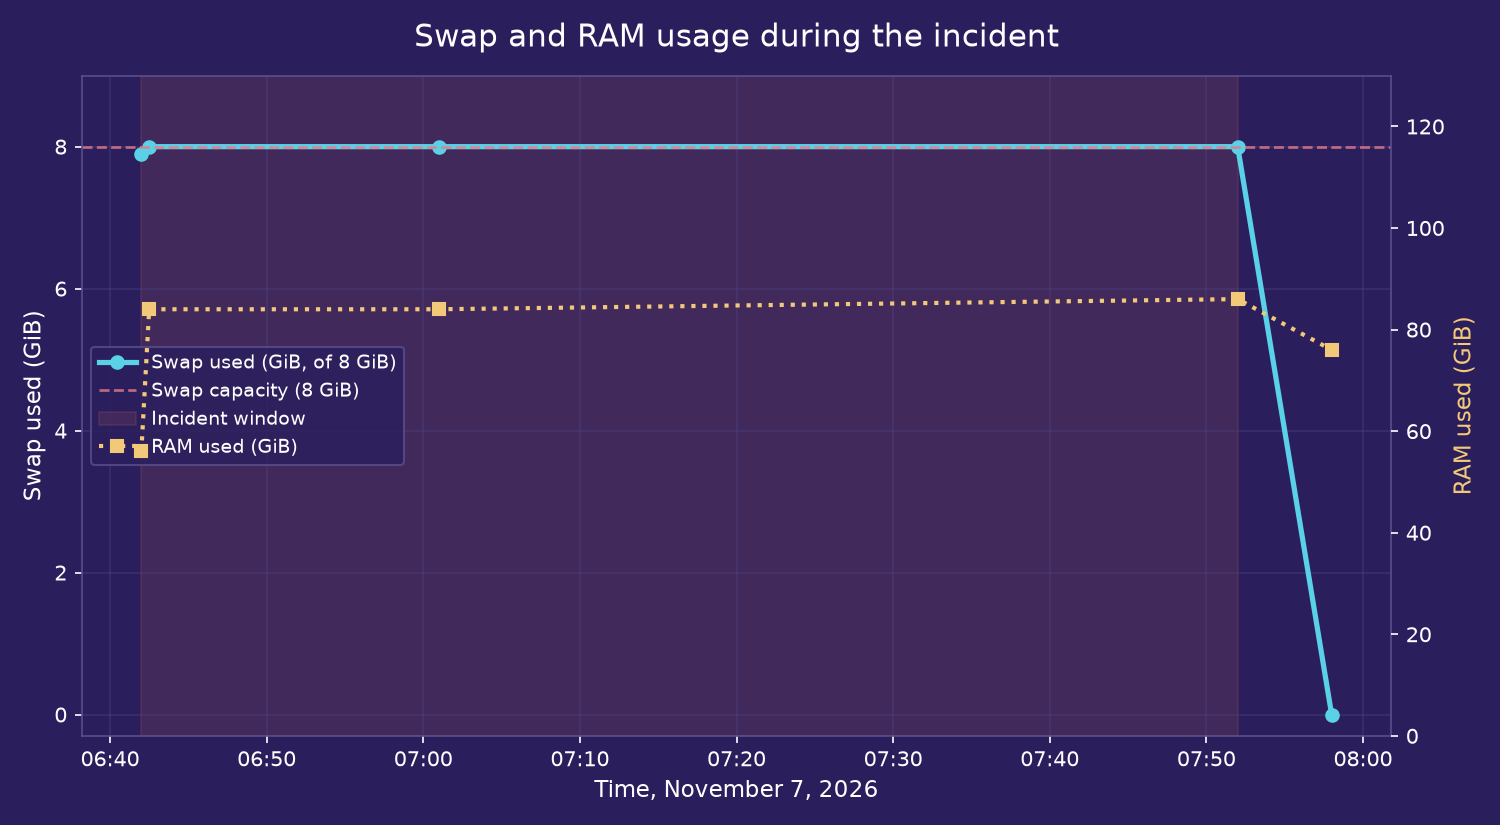
--max-context 262144 --kv-resident 32768 --resident-budget-gib 40Immediate action (mitigation, not a fix): Under time pressure, I slimmed the configuration down: the context window to an eighth, the RAM budget to 40 percent of the original values – --max-context 32768 --kv-resident 8192 --resident-budget-gib 16 (later tried 28 as well). The configuration itself was adjusted within minutes – but that didn’t immediately relieve the actual memory pressure: swap stayed pinned at 8.0 of 8.0 GiB until the machine was fully rebooted about an hour later (see chart below). The mistake I made was assuming the slimmed-down configuration had already ended the incident, just because it stopped making things worse.
The regression the incident left behind
I remembered earlier throughput numbers well above 40 tokens per second. A first measurement with a small benchmark script against the local OpenAI-compatible API showed only 26 to 31 tok/s, consistently across four prompt lengths (50 to 15,000 input tokens). A performance regression of roughly 40 percent that had outlived the acute incident.
Root cause analysis instead of trial and error
Instead of turning knobs at random, I had my Hermes agent work through this systematically with me – form a hypothesis, test it in isolation, falsify or confirm it, only then act.
Four prompt lengths, three runs each, measured via usage.completion_tokens / response time against /v1/chat/completions.
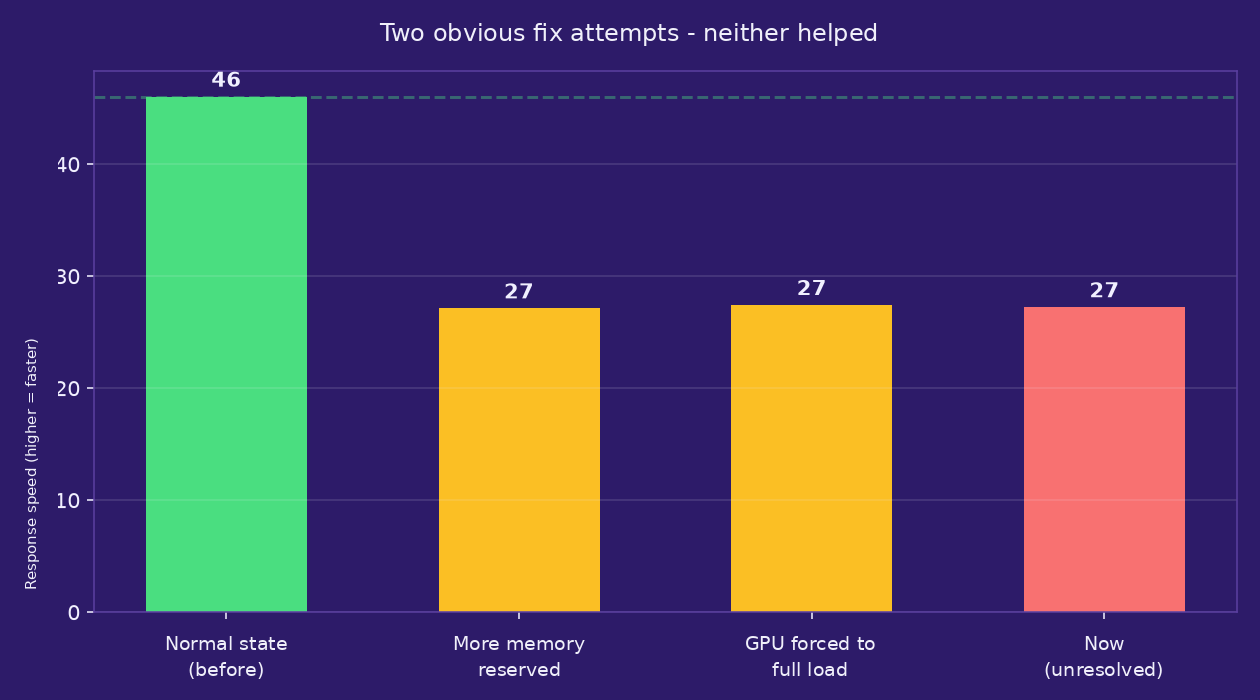
Hypothesis: too little RAM budget for resident experts. Raised resident-budget-gib from 16 to 28 GB (+75 percent), restarted the server, measured again. Result: no change (~27 tok/s) – falsified.
Hypothesis: GPU in power-saving mode. rocm-smi showed the iGPU at ~800 instead of a possible 2900 MHz, performance level set to “auto.” Forced with power_dpm_force_performance_level=high, confirmed full clock speed. Result: still no change – falsified.
Speculative-decoding hit rate (unchanged, 60-68% vs. a historical 65-75%), GPU driver errors (dmesg clean), CPU throttling (governor “performance”), PCIe bandwidth (~80 GB/s, unchanged).
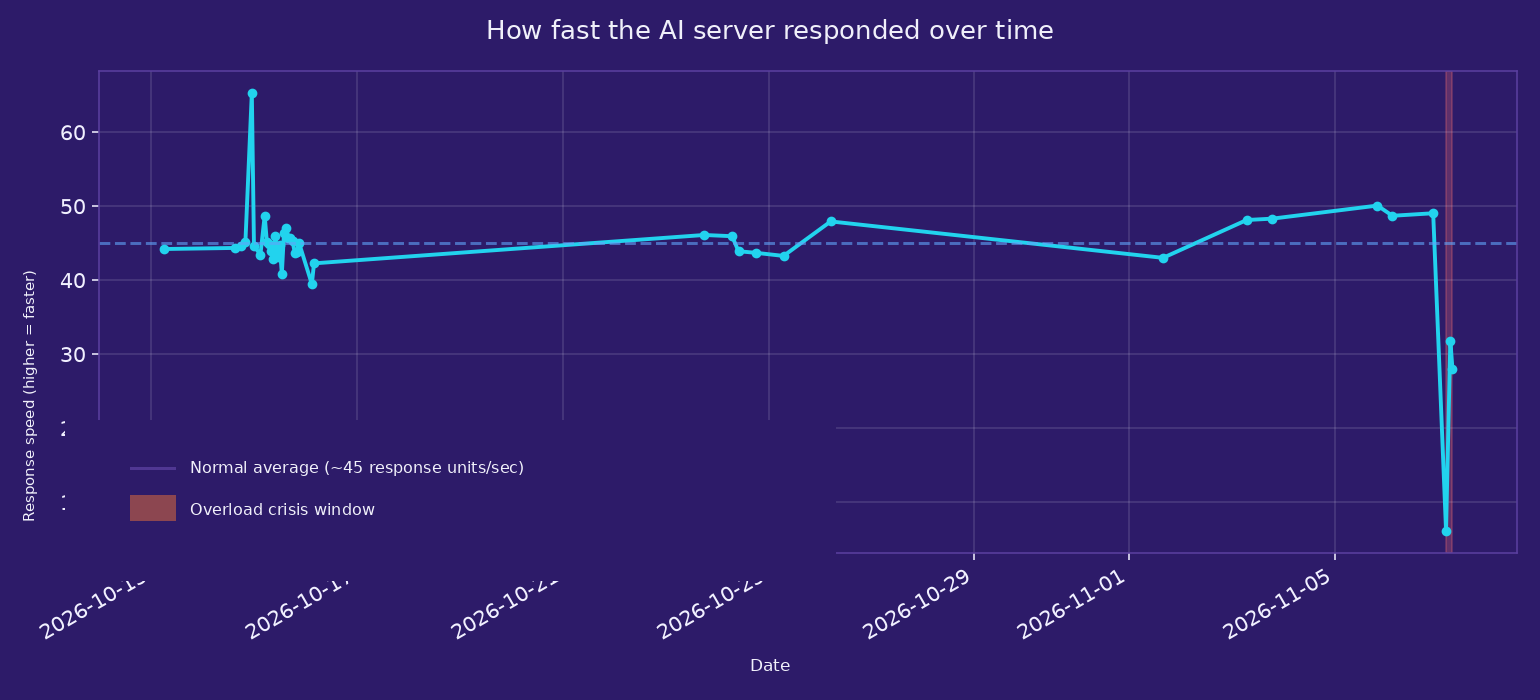
Historical telemetry instead of more one-off measurements: Strata logs throughput and speculative-decoding details on every request. Analysis of 8,063 log lines over three weeks, grouped by hour: consistently stable at 43-49 tok/s from October 14 through November 6. The drop starts exactly on November 7 between 4 and 7 a.m. – the same window as the swap incident.
Reboot as a diagnostic step: incident closed, regression remains
A full system reboot seemed like the cleanest next step to rule out any lingering state in the memory or driver subsystem. After the reboot: memory fully relieved (39 GB available), swap at 340 KB of 8 GiB – the incident was unambiguously over. Throughput stayed at 25-30 tok/s anyway, with all 24,576 model experts already warmed up in the GPU cache. That’s the key diagnostic data point: if a clean reboot doesn’t fix a symptom, it’s no longer an aftereffect of the incident – it’s an independent cause, usually config drift, the state a configuration ends up in under pressure and then just sits in.
One false lead along the way: the log showed resident RAM mode: 0.00 GiB of experts in RAM, 24576 in the GPU cache – not a bug, but normal behavior on this unified-memory hardware (AMD Strix Halo): with --expert-cache auto, all 24,576 experts fit directly into the GPU cache here. resident-budget-gib only matters when experts don’t fit – here the parameter was irrelevant from the start, despite looking like the obvious suspect.
The actual culprit: --kv-resident, the streaming parameter for the context cache between GPU and pinned RAM. The engine internally enforces a minimum of 20,480 cells – the value reduced to 8,192 in the emergency config was effectively clamped up to 20,480, which produced more streaming overhead per token than the old, higher value of 32,768.
Fix: roll back config drift, don’t guess at a new one
With enough free memory available again (37 GB free, no competing process starts), I deliberately rolled back the three parameters that had been reduced under pressure – not a new experiment, but a controlled rollback to the last known-good state, monitored the entire time it loaded.
| Parameter | Emergency config (incident response) | Rolled back (fix) |
|---|---|---|
--max-context |
32,768 | 262,144 |
--kv-resident |
8,192 | 32,768 |
--resident-budget-gib |
28 | 40 |
RAM and swap stayed stable throughout the rollback (swap under 250 MB of 8 GiB) – no repeat of the original incident. Throughput is back close to the historical baseline of 43-49 tok/s, and for the medium-prompt scenario it’s right in the middle of it.
Addendum: did the BIOS change to VRAM actually help?
The second decision came directly out of the same crisis, just on a side track: while checking GPU memory during the acute swap overload (rocm-smi, the same command I later used to check the GPU clock speed), it turned out that only about 1.1 GiB of the 16 GiB fixed in the BIOS as dedicated graphics memory was actually being used – the rest simply wasn’t available to the system as RAM, exactly where it was badly needed right then. My Hermes agent and I therefore recommended shrinking that BIOS reservation from 16 to 8 GiB before the planned reboot, to free up the unused memory. The change was applied directly in the BIOS during the reboot – a side issue to this article’s main incident, but decided the same evening.
Confirmed via rocm-smi and free -h: the VRAM total now reads 8 instead of 16 GiB, and usable system RAM has been 115 instead of the previous 107 GiB since the reboot – exactly the expected 8 GiB more, no rounding error, no side effect on GPU performance in the benchmarks above.
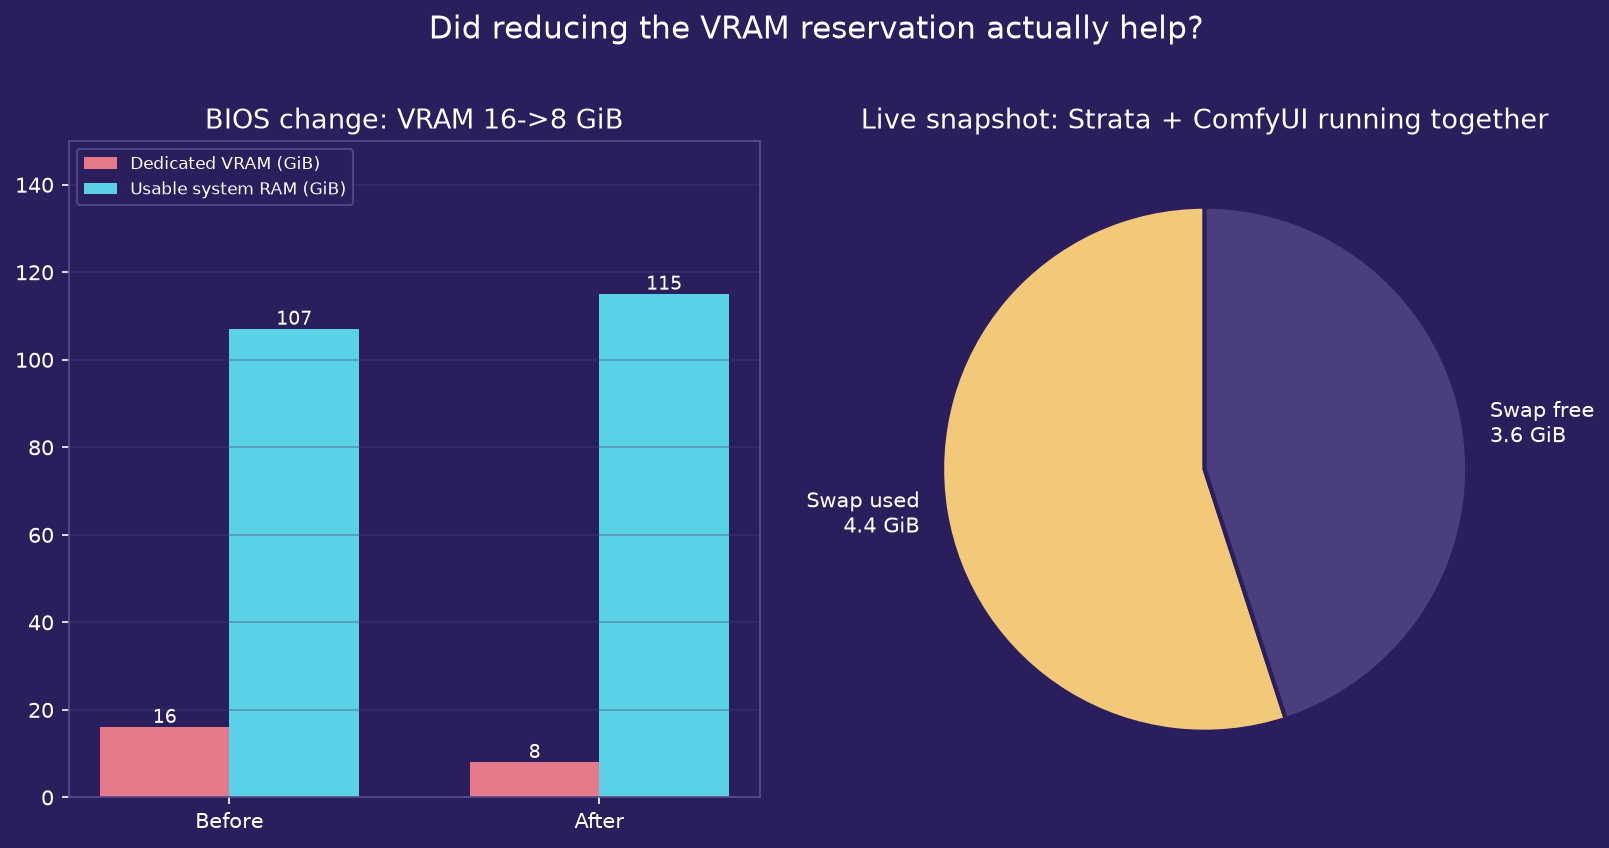
My assessment: the change was the right call and delivered exactly what the data promised – eight more GiB of usable memory, with no measurable downside. But it’s not a blank check for running unlimited workloads in parallel. The current snapshot, with 4.4 of 8 GiB of swap used while Strata and ComfyUI run at the same time, shows that the extra headroom gets used up fast under real load – not an incident yet, load average is unremarkable, but a clear early warning sign. The real lesson from the first incident still stands: starting several memory-hungry services at once is the actual risk factor, regardless of how much extra headroom a BIOS change creates.
Re-checked (Nov. 10, after a good 3 days of uptime since the reboot): Zero OOM kills across the entire kernel log since boot – not just in the first few hours, but over the full observation window of now roughly 73 hours. The exact scenario that caused the original incident to crash – the kernel killing the assistant for lack of memory – hasn’t recurred a single time since, despite several agent processes running at once on the same machine. Memory pressure itself is unchanged and still high: swap currently sits at 7.7 of 8 GiB, essentially maxed out. That’s the real stability proof for the BIOS change: not that memory pressure disappeared, but that even after several days of continuous operation it still hasn’t tipped over into a disaster. Crisis prevented, not fully solved – but that was exactly the bar I set for it.
What’s notable about this re-check: the real question – whether the change improved stability, not just speed – didn’t come from my agent, it came from me. With 15 years of experience with exactly these kinds of systems, the first answer (tokens per second) wasn’t enough for me; I had to push back and redirect the agent to the actual question. The verification itself – kernel log, journal, memory stats, all pulled together – then took human and AI together just a good half hour.
Conclusion
My original diagnosis was only half right: the acute incident – the swap overload itself – was already resolved by the reboot. The actual cause of the performance regression was something else: an emergency configuration, thrown together in minutes under time pressure, that had taken on a life of its own and quietly turned into a permanent regression, long after the triggering incident was fixed. A reboot can reset process state, but it can’t correct a configuration file you changed yourself. The real lesson, then, isn’t “swap overloads are dangerous” – that much was already clear – it’s this: any emergency configuration built under pressure needs a second, deliberate look once the pressure is off, or a temporary mitigation silently turns into a permanent performance loss.
- Strata server log
strata-unsloth-ud-iq4_xs.log, 8,063 entries analyzed, Oct 14 – Nov 7, 2026 - Local Prometheus monitoring with a custom GPU textfile collector
- Local or Cloud? What Ten Days of AI Agent Operations Taught Us About Cost and Limits – same machine, same Strata installation, more background on the setup
- AMD ROCm SMI documentation – the tool used for the GPU clock-speed check