

The exception java.lang.OutOfMemoryError can become a developer’s nightmare. This exception often strikes without warning — only under full load in production. OutOfMemoryErrors are hard to spot during development, because the importance of automated load tests that could simulate such a scenario is frequently underestimated. When the worst case happens in production and the application dies with an OutOfMemoryError, the forensic work begins for the developer. The task is to find out in which situations the application consumes too much memory, and how to prevent the application from crashing. This post covers how to approach the analysis of such an error. To better understand this exception, we’ll first look at the Java memory architecture.
Java Memory Architecture
The Java platform has automatic memory management, which is defined in the Java Virtual Machine Specification. At runtime, a distinction is made between different memory areas. There is a memory area that is visible to all threads. This memory area contains, among other things, the so-called Method Area (PermGen) and the Heap. Another memory area is exclusively visible only to the thread executing it.

The Method Area is initialized when the JVM starts, and it holds the loaded classes. The Heap, on the other hand, manages all objects and arrays created at runtime. The Heap is visible to all threads.
The JVM specification further prescribes automatic memory management of the heap in the form of what’s called Garbage Collection, which is performed by the garbage collector. Garbage collection is an explicit deallocation of objects on the heap that happens automatically. A garbage collection should normally run without any intervention from the developer.
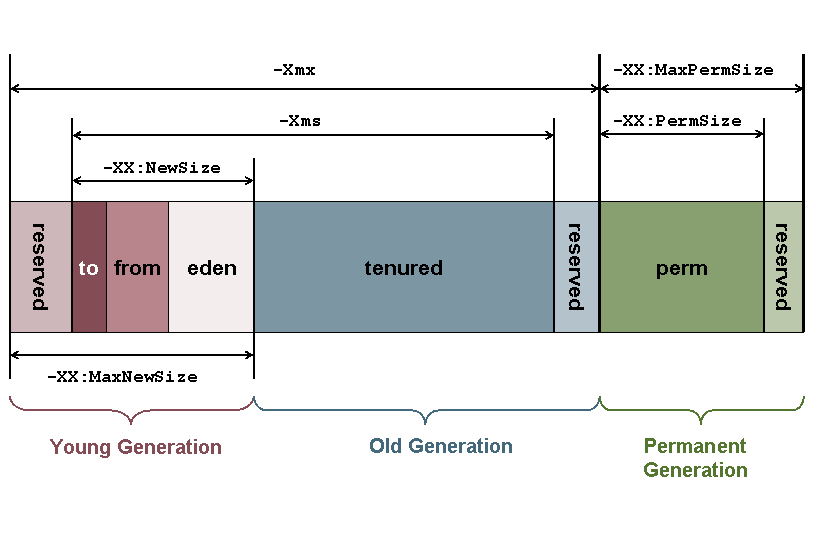
Figure 2 shows the structure of the Oracle HotSpot implementation of the heap, along with the JVM parameters you can use to increase the memory at the respective locations. The heap is divided into several generations: the Young Generation and the Old Generation. The Young Generation serves to optimize garbage collection. It’s also meant to simplify the allocation of new objects as well as the deallocation of objects that are no longer needed. Once objects exceed a certain age, they are copied into the slower Old Generation. Besides these two generations, there was also a Permanent Generation up until Java 8. However, in the course of unifying the codebases of the HotSpot and JRockit JVMs, the Permanent Generation was removed (source).
Now that the structure of the Java memory architecture has been clarified, let’s look at how one can monitor the Java memory architecture.
Monitoring the Java Memory Architecture
The Java platform ships with a range of tools for monitoring the Java memory architecture. The simplest tool is the console program jmap. jmap gives the user textual information about the available JVM memory areas on the console, such as the Young Generation and Old Generation. The following listing shows the command you need to run in the console to view information about the Java heap using jmap. First, you need to determine the process ID of the Java process you want to monitor using the console program jps. Then, using the process ID you found and the -heap parameter, you can call the jmap program and get information about the available memory:
bernd@mbp ~ $ jps
7409 Runner
25297 Jps
bernd@mbp ~ $ jmap -heap 7409
...
Heap Usage:
PS Young Generation
Eden Space:
   capacity = 60817408 (58.0MB)
   used     = 24817576 (23.667884826660156MB)
   free     = 35999832 (34.332115173339844MB)
   40.80669797700027% used
...
13008 interned Strings occupying 1759648 bytes.
Of course, there are also graphical tools for monitoring the Java memory architecture. Below, the two tools JConsole and VisualVM are briefly introduced.
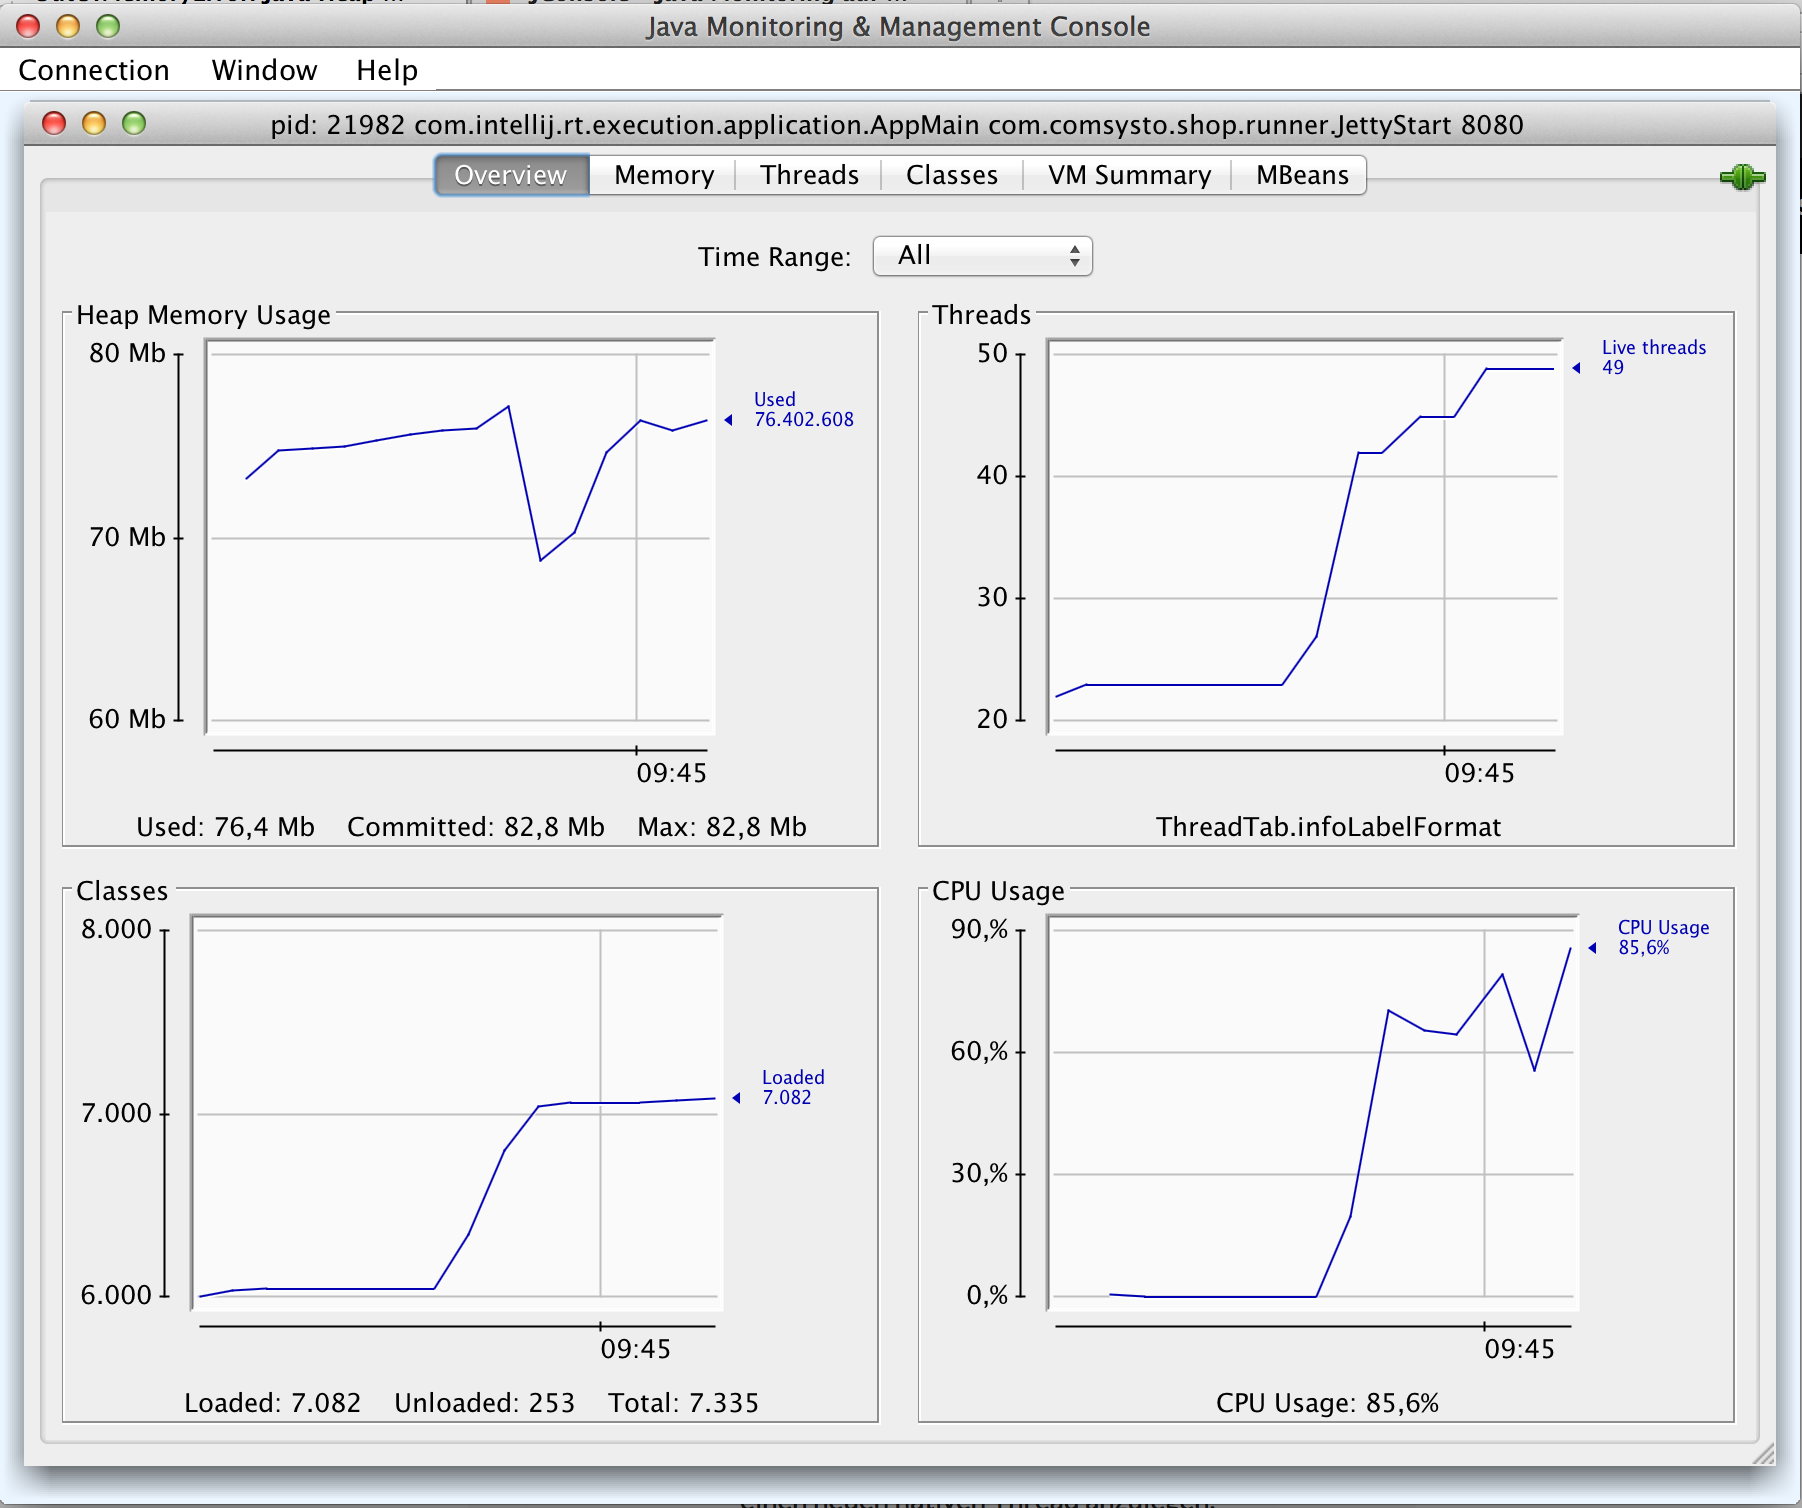
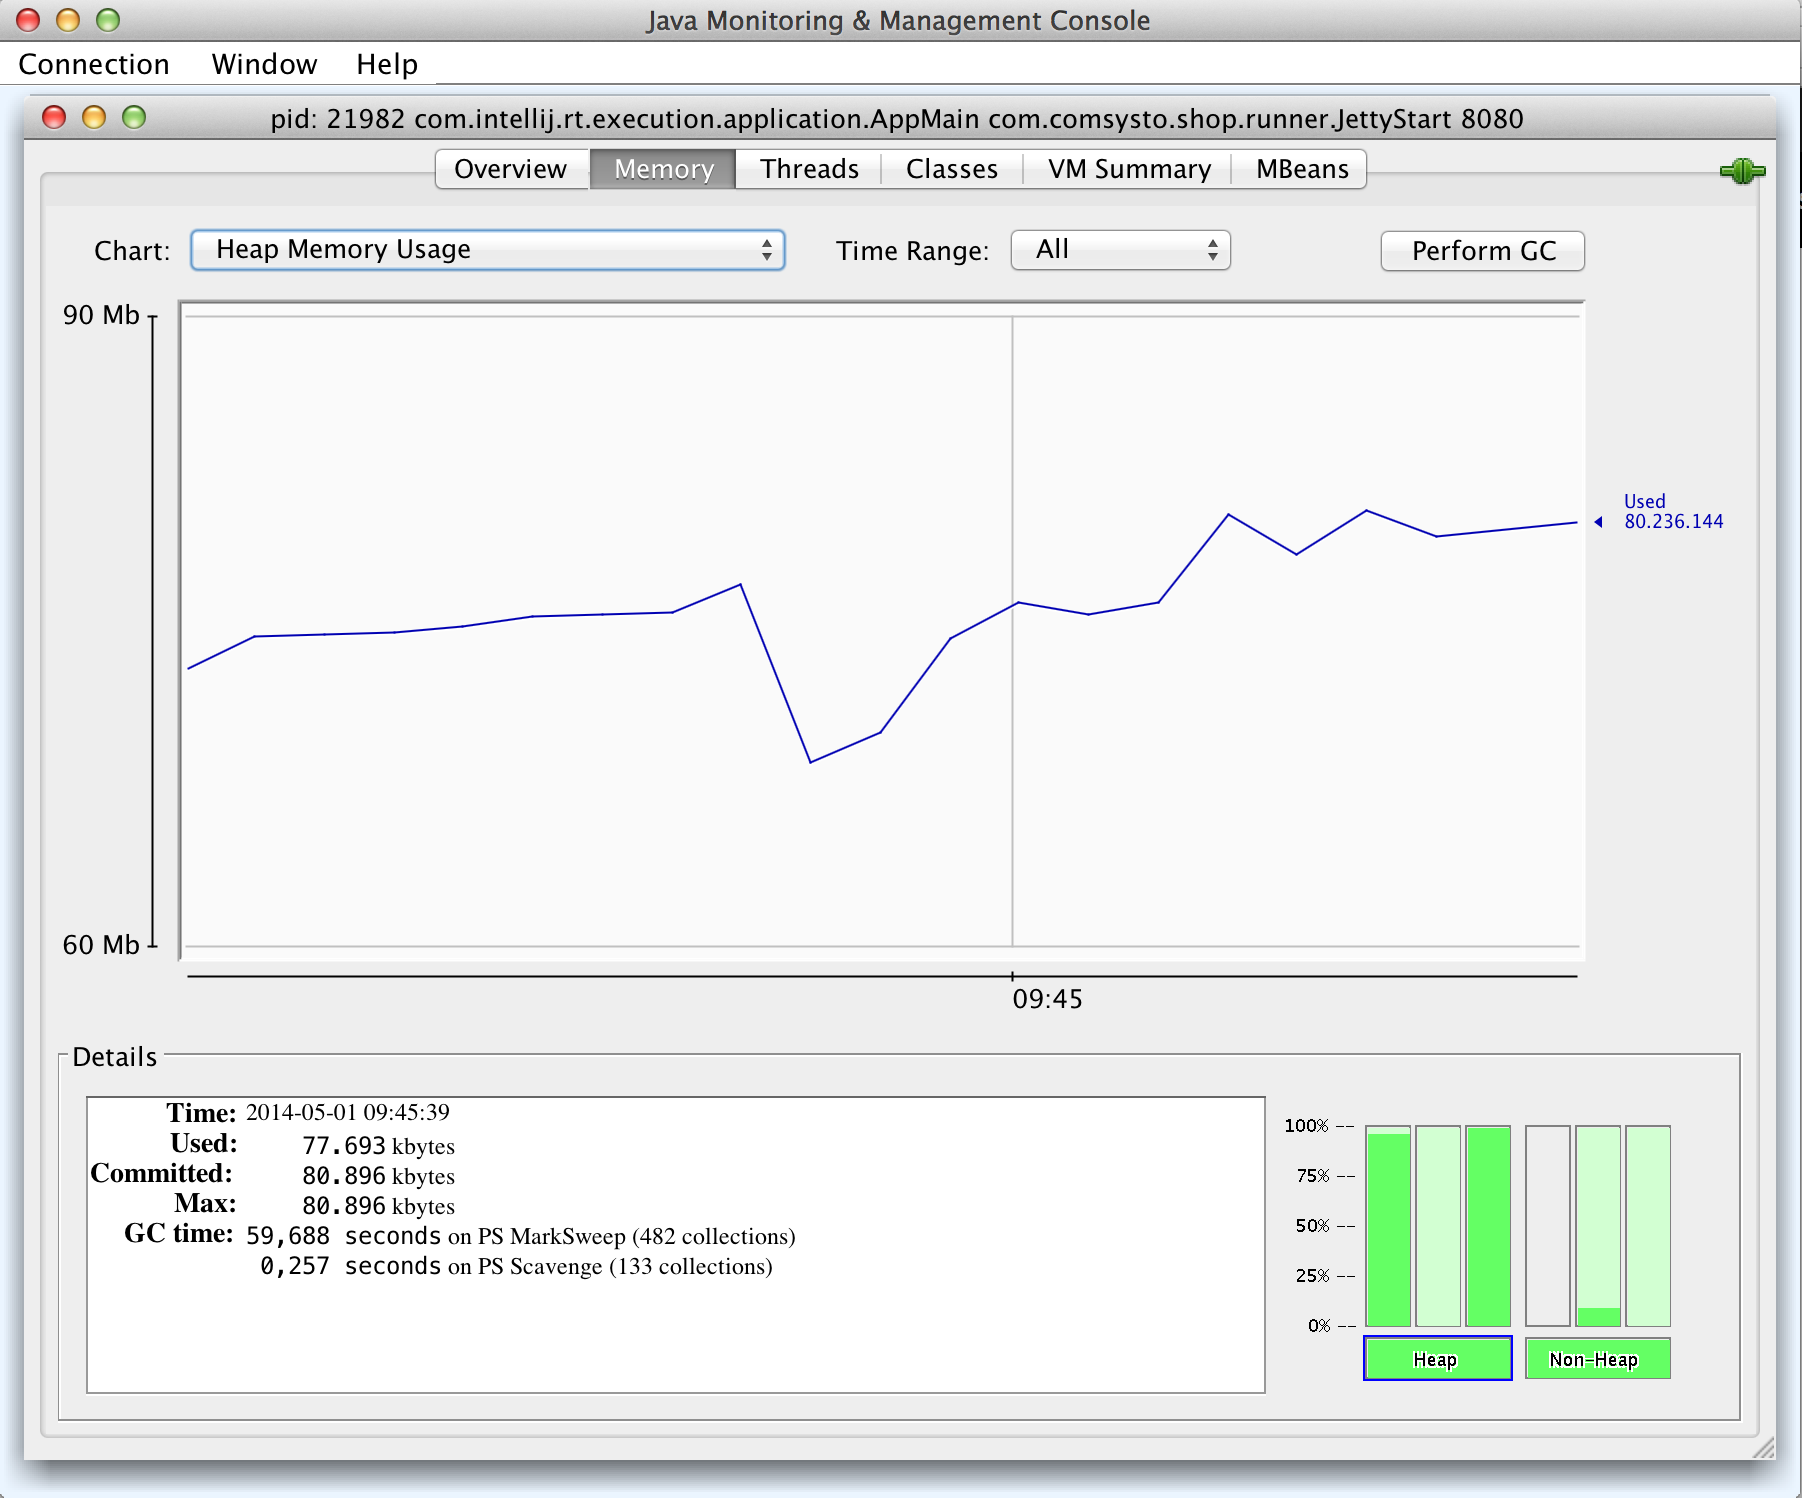
JConsole is a Swing application that has shipped with the JDK since Java version 1.5, and is used to monitor Java processes via JMX on local or remote systems. JMX stands for Java Management Extension and is an evolution of a Java standard that also enables communication between different Java processes.
Last login: Wed Apr 30 19:51:45 on ttys000
bernd@mbp ~ $ jconsole
After starting JConsole from the command line, a start screen appears showing all local Java processes; these can be monitored with a double-click. To monitor remote JVMs, the corresponding RMI access must be enabled on the target system.

Last login: Thu May  1 10:08:40 on ttys003
bernd@mbp ~ $ jvisualvm
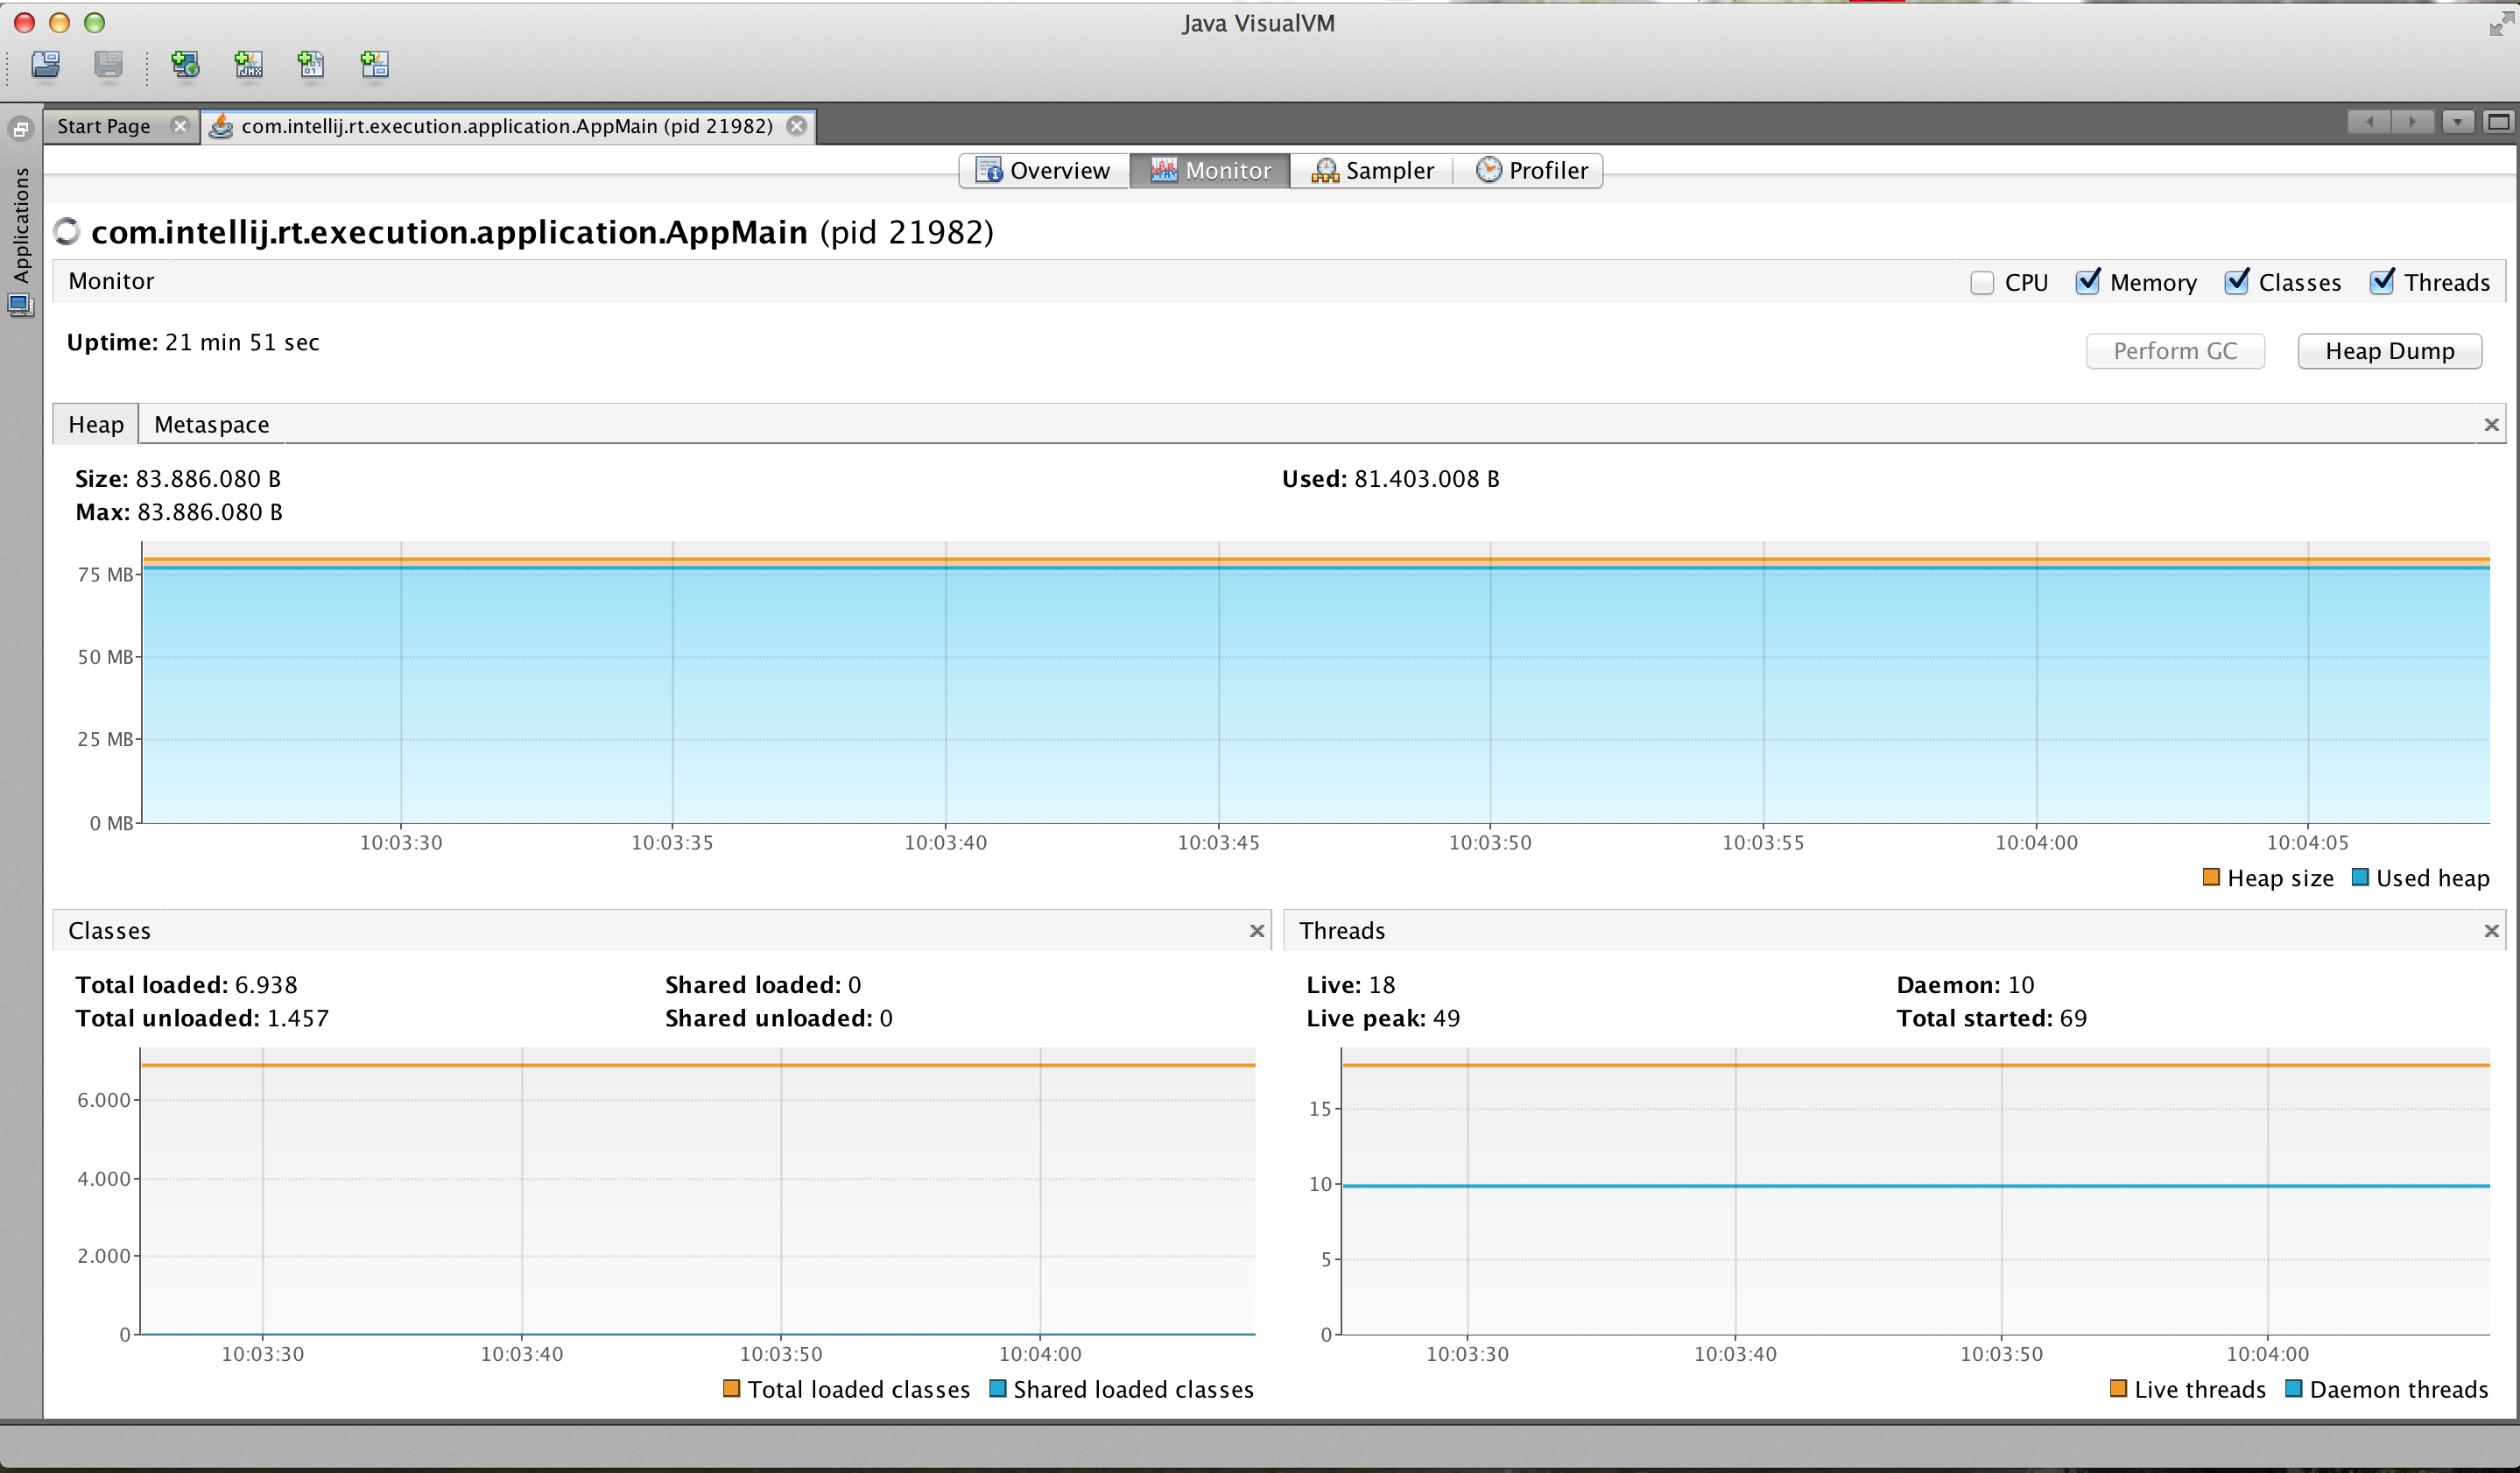
VisualVM is another graphical tool with simple profiling capabilities, which also provides a graphical interface for the JDK tool jstack, which can be used to create thread dumps. VisualVM is part of JDK 6. Within the JDK, however, VisualVM is called Java VisualVM and can be launched from the command line with the jvisualvm command. The current version of VisualVM can be found on the website and can be installed separately from the JVM.
Now that we know how to monitor the JVM, let’s next look at the different kinds of java.lang.OutOfMemoryError that can occur.
Types of OutOfMemoryError
A memory overflow always occurs when the garbage collector can no longer deallocate memory to satisfy a memory request for instantiating a new object. Such an error leads to a java.lang.OutOfMemoryError, which manifests itself in one of the following textual descriptions:
| OutOfMemoryError | Bedeutung |
|---|---|
| Java heap space | Der Garbage Collector kann keinen Speicher mehr freimachen, um eine Speicheranfrage für ein neues Objekt zu erfüllen. |
| Requested array size exceeds | Es wird versucht ein Array auf dem Heap anzulegen, das größer ist als der Heap selber. |
| PermGen space | Es steht nicht genug Speicher zur Verfügung, um Klassen Informationen im Method Area abzulegen oder der Code Cache vollläuft. |
| unable to create new native thread | Es existieren zu viele Threads innerhalb der JVM. Es steht nicht mehr genug Speicher zur Verfügung , um einen neuen nativen Thread anzulegen. |
| request | Der Heap muss erweitert werden, aber auf Betriebssystem Seite steht nicht mehr genügend Speicher zur Verfügung. |
| GC overhead limit exceeded | Der Garbage-Collector ist überdimensional oft und zu lange aktiv, so dass das eigentliche Programm nicht mehr vorankommt. |
Now that we’ve briefly introduced the different kinds of OutOfMemoryError, let’s take a closer look at how such an error arises and how to track it down.
Java Memory Leaks
All objects are created on the heap. The lifetime of an object on the heap depends on whether the object is referenced by another object. When certain thresholds are exceeded, the garbage collector checks whether an object is still referenced. If an object is no longer referenced, the garbage collector marks it as “garbage” and, in a later step, cleans it up and frees its memory.
So-called Garbage Collection Root (GC Root) references are decisive for an object’s survival. A GC Root is an object that has no incoming references. GC Roots are responsible for keeping referenced objects in memory. If an object is neither directly nor indirectly referenced by a GC Root, it is marked as “unreachable” and made available for garbage collection. The following kinds of garbage collection roots can be distinguished:
- Temporary variables on a thread’s stack
- Static fields of classes
- Special native references in JNI
GC Roots are best illustrated with a concrete code example:
public class MyPage extends org.apache.wicket.markup.html.WebPage {

  //The list is reachable
  //as long as the class is loaded
  public static final List STATIC = new ArrayList();

  //The list is reachable
  //as long as an instance of the page exists
  private final List instance = new ArrayList()

  //The list is reachable
  //as long as the method is executing,
  //even if the list is not used
  private void myMethod(List parameter) {

    //as long as the method is executing,
    //the list is reachable from the stack
    List local = new ArrayList();
  }

}
GC Root objects are responsible for the following OutOfMemoryError problems:
- Objects that are never used again in the application code, but still have a GC Root reference, cause Java memory leaks, since these objects cannot be cleaned up by the garbage collector.
- Using large object trees that are kept in memory (e.g. caches) can result in not enough heap being available. In that case, the memory for the application needs to be increased.
- Too many temporary objects, which cause too much memory to be needed temporarily during processing in the Java code.
Java memory leaks always arise when an object still has a GC Root reference but is no longer used by the application. Such objects are called “loitering objects”. Loitering objects occupy JVM memory for the entire runtime of the application. These “object corpses” cause the application’s memory to no longer be sufficient, resulting in an OutOfMemoryError. An OutOfMemoryError is often triggered by static collections. Objects get added to the collection but are never removed again. The added objects are referenced by the static collection entries and, because of the (static) GC Root reference, can no longer be freed.

In the context of Java memory leaks, there’s also frequent talk of so-called dominators and dominator trees. Dominators are a concept from graph theory. A dominator is a node through which an entire subgraph is reachable. Applied to memory management, this means that an object A is a dominator of another object B if there is no other object C that holds a reference to B. So if the root reference is released, the entire dominator tree is released as well. Very large dominator trees are therefore very good potential candidates when hunting for memory leaks.
The memory leak hunt begins with creating a heap dump. Below, we’ll first look at ways to create a heap dump.
Java Heap Dump
A heap dump is a textual or binary snapshot of the Java heap. From the information contained in a heap dump, various tools can be used to reconstruct the complete set of objects created by an application. A heap dump also contains all the references between objects. In case of an error, a heap dump can be generated automatically when an OutOfMemoryError occurs, using the JVM option -XX:+HeapDumpOnOutOfMemoryError. Heap dumps usually contain the following kinds of objects:
- Live objects — objects reachable via a GC Root reference
- All objects that are no longer referenced
As an alternative to the JVM option, a heap dump can be created with the console tool jmap, which we already got to know for monitoring the JVM. The following listing shows how to create a heap dump from the console.
bernd@mbp ~ $ jps
16497 AppMain
16520 Jps
bernd@mbp ~ $ jmap -dump:live,format=b,file=dump.hprof 16497
Dumping heap to /Users/berndzuther/dump.hprof ...
Heap dump file created
Of course, there’s also a graphical tool, such as VisualVM, with which you can create a heap dump.
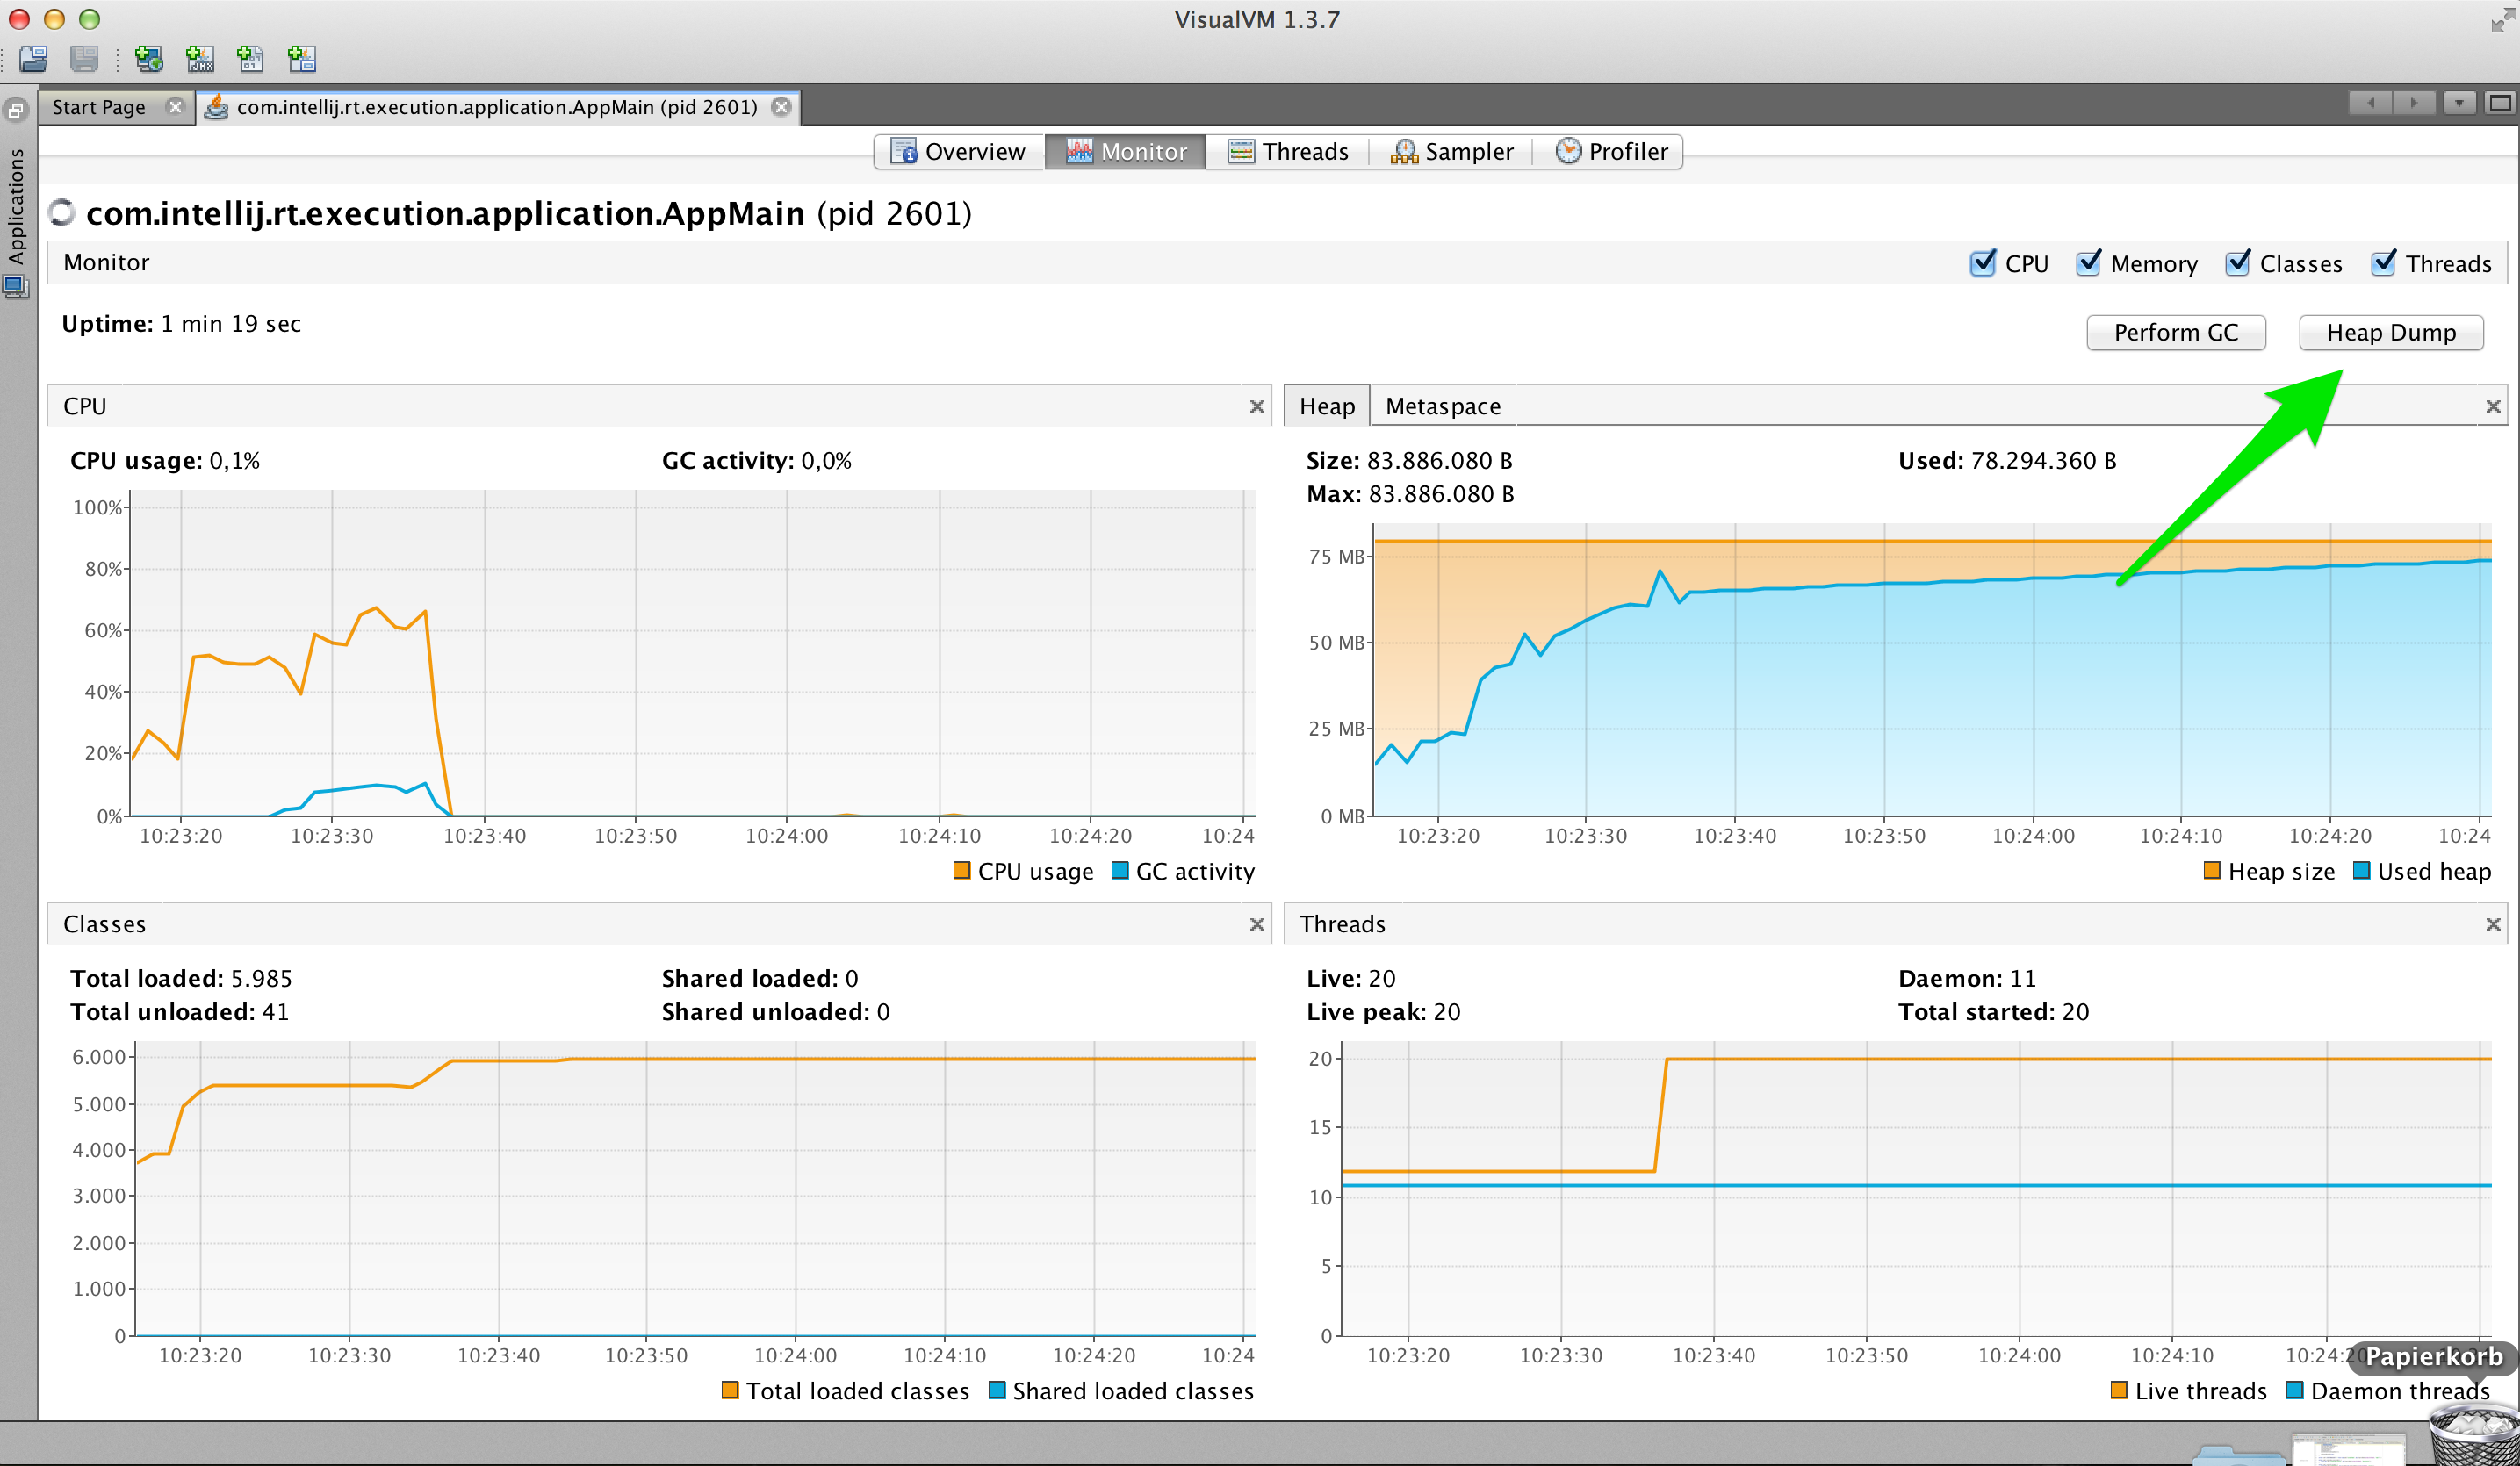
Now that we can generate a heap dump, we can start analyzing it. The following tools are available to us for that.
Heap Dump Analysis
JDK 1.6 ships with a small tool called jhat (Java Heap Analysis Tool) for analyzing heap dumps. jhat starts a local web server. Using the default settings, the heap dump can be analyzed at the address http://localhost:7000. Unfortunately, the tool offers only very rudimentary functions for evaluating the heap dump, and it’s not very pleasant to use.
bernd@mbp ~ $ jhat -J-mx2000m dump.hprof
Reading from dump.hprof...
Dump file created Fri May 02 18:37:18 CEST 2014
Snapshot read, resolving...
Resolving 2013119 objects...
A great tool for analyzing heap dumps is the Memory Analyzer (MAT), which is capable of processing very large heap dumps. Older tools often have the problem that the heap dump must be loaded entirely into memory for analysis, typically requiring around 1.5 times the heap size for the analysis. In other words, a 2GB heap would require 3GB of heap just to analyze it. The Memory Analyzer first indexes a heap dump so that it can afterward perform the analysis on the dump in a reasonable amount of time and with manageable memory consumption.
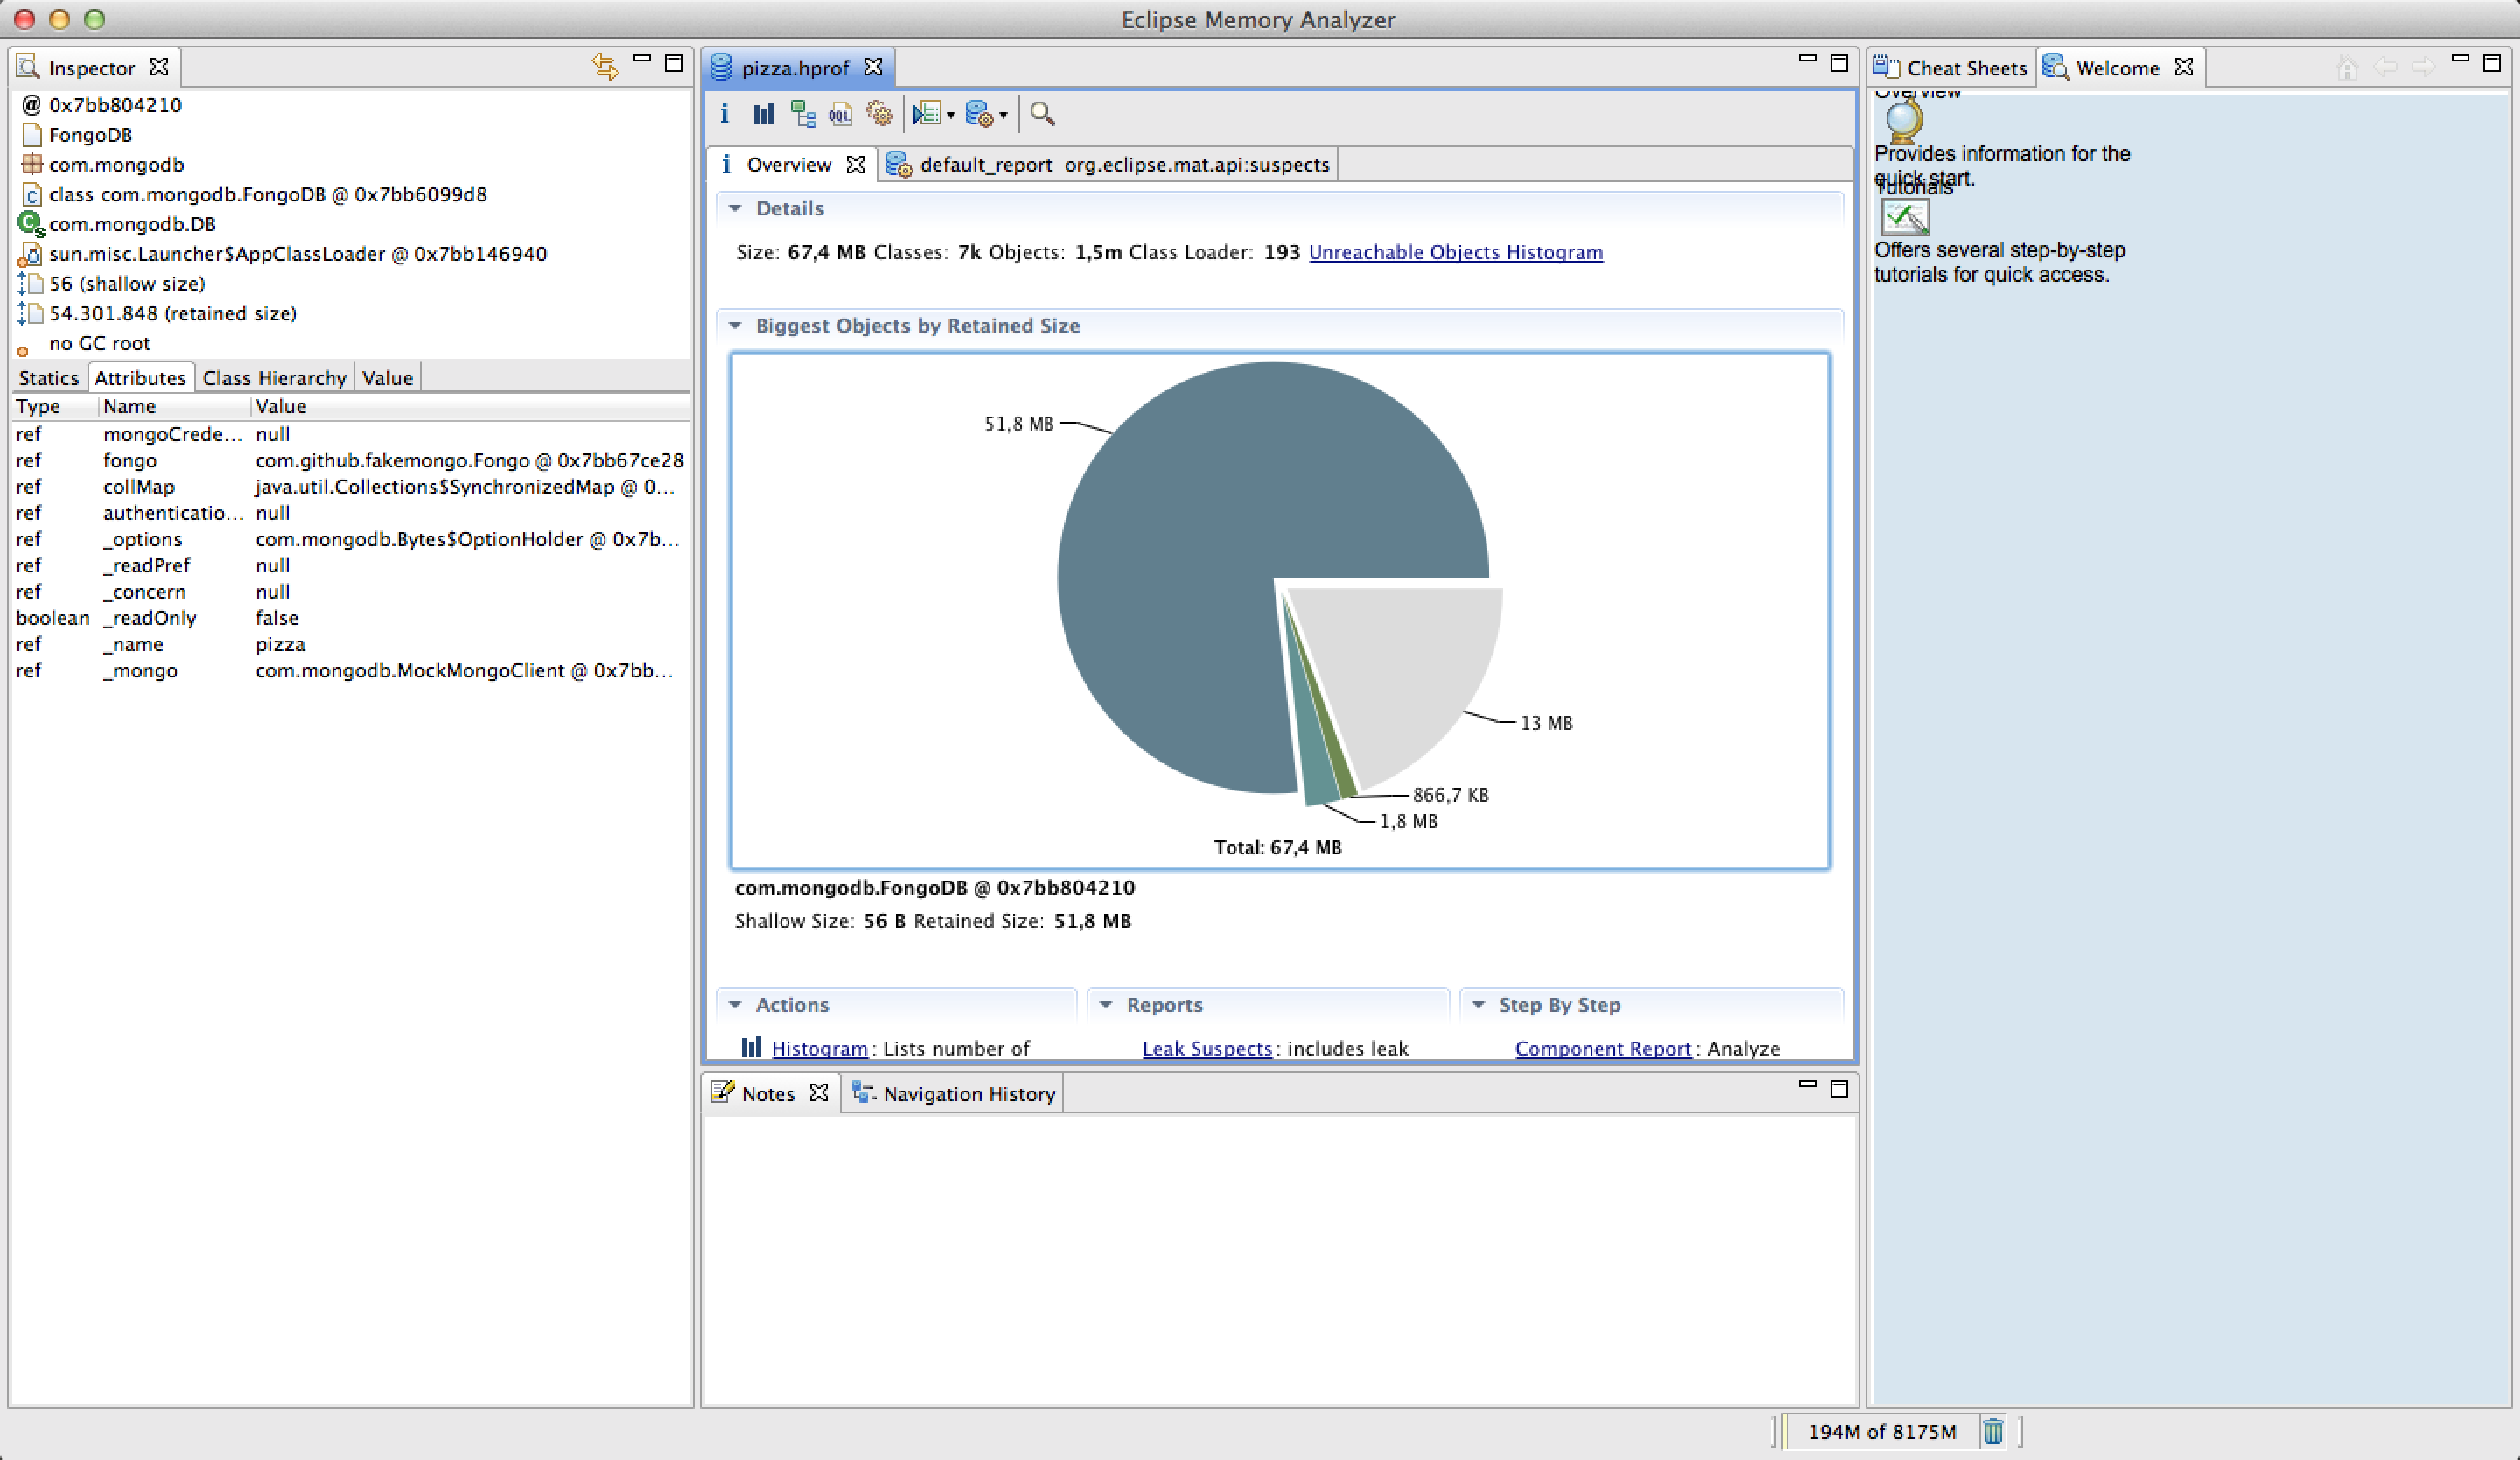
The Memory Analyzer analyzes the reference relationships between objects on the heap and derives dominator trees from them. It also searches the heap for dominators (in MAT these are called accumulation points), which keep large amounts of memory alive, and presents them as a “Suspect Report”, as shown in Figure 9.

To query objects in a heap dump, there is the so-called Object Query Language (OQL). OQL provides more flexibility for queries and makes it possible to filter objects by specific criteria. OQL uses the JavaScript expression language for this.
An OQL query has the following structure:
select
         [ from [instanceof]
         [ where  ] ]

--selects all strings that have more than 100 characters
select s from java.lang.String s where s.count >= 100

--selects all int arrays with more than 256 elements
select a from int[] a where a.length >= 256
In the next step, we’ll run a Java heap analysis using the Memory Analyzer on a concrete example.
Online Shop – Example Heap Dump Analysis
As part of the meetup “Boost your Java Enterprise Stack with MongoDB“, the company comSysto published an online shop in its GitHub repository. The following YouTube video shows what functionality this online shop offers, and gives a short introduction to it.
[youtube http://www.youtube.com/watch?v=uJpFp9qR4Z4&rel=0&hd=1]
Below, we’ll use a fork of this online shop to perform a memory leak analysis. This fork can be checked out from my GitHub repository. The following listing shows what needs to be done:
bernd@mbp ~ $ git clone https://github.com/zutherb/memory-leak-detection.git
Cloning into 'memory-leak-detection'...
remote: Counting objects: 1231, done.
remote: Compressing objects: 100% (632/632), done.
remote: Total 1231 (delta 211), reused 1231 (delta 211)
Receiving objects: 100% (1231/1231), 5.72 MiB | 1.56 MiB/s, done.
Resolving deltas: 100% (211/211), done.
Checking connectivity... done.
bernd@mbp ~ $ cd memory-leak-detection
bernd@mbp ~/memory-leak-detection (master)$ git branch -r
  origin/HEAD -> origin/master
  origin/master
  origin/memory-leak-fix
In the next step, let’s get familiar with the repository. The repository has two branches. The master branch has a memory leak built in, and the memory-leak-fix branch contains the online shop in a version that is free of that memory leak.
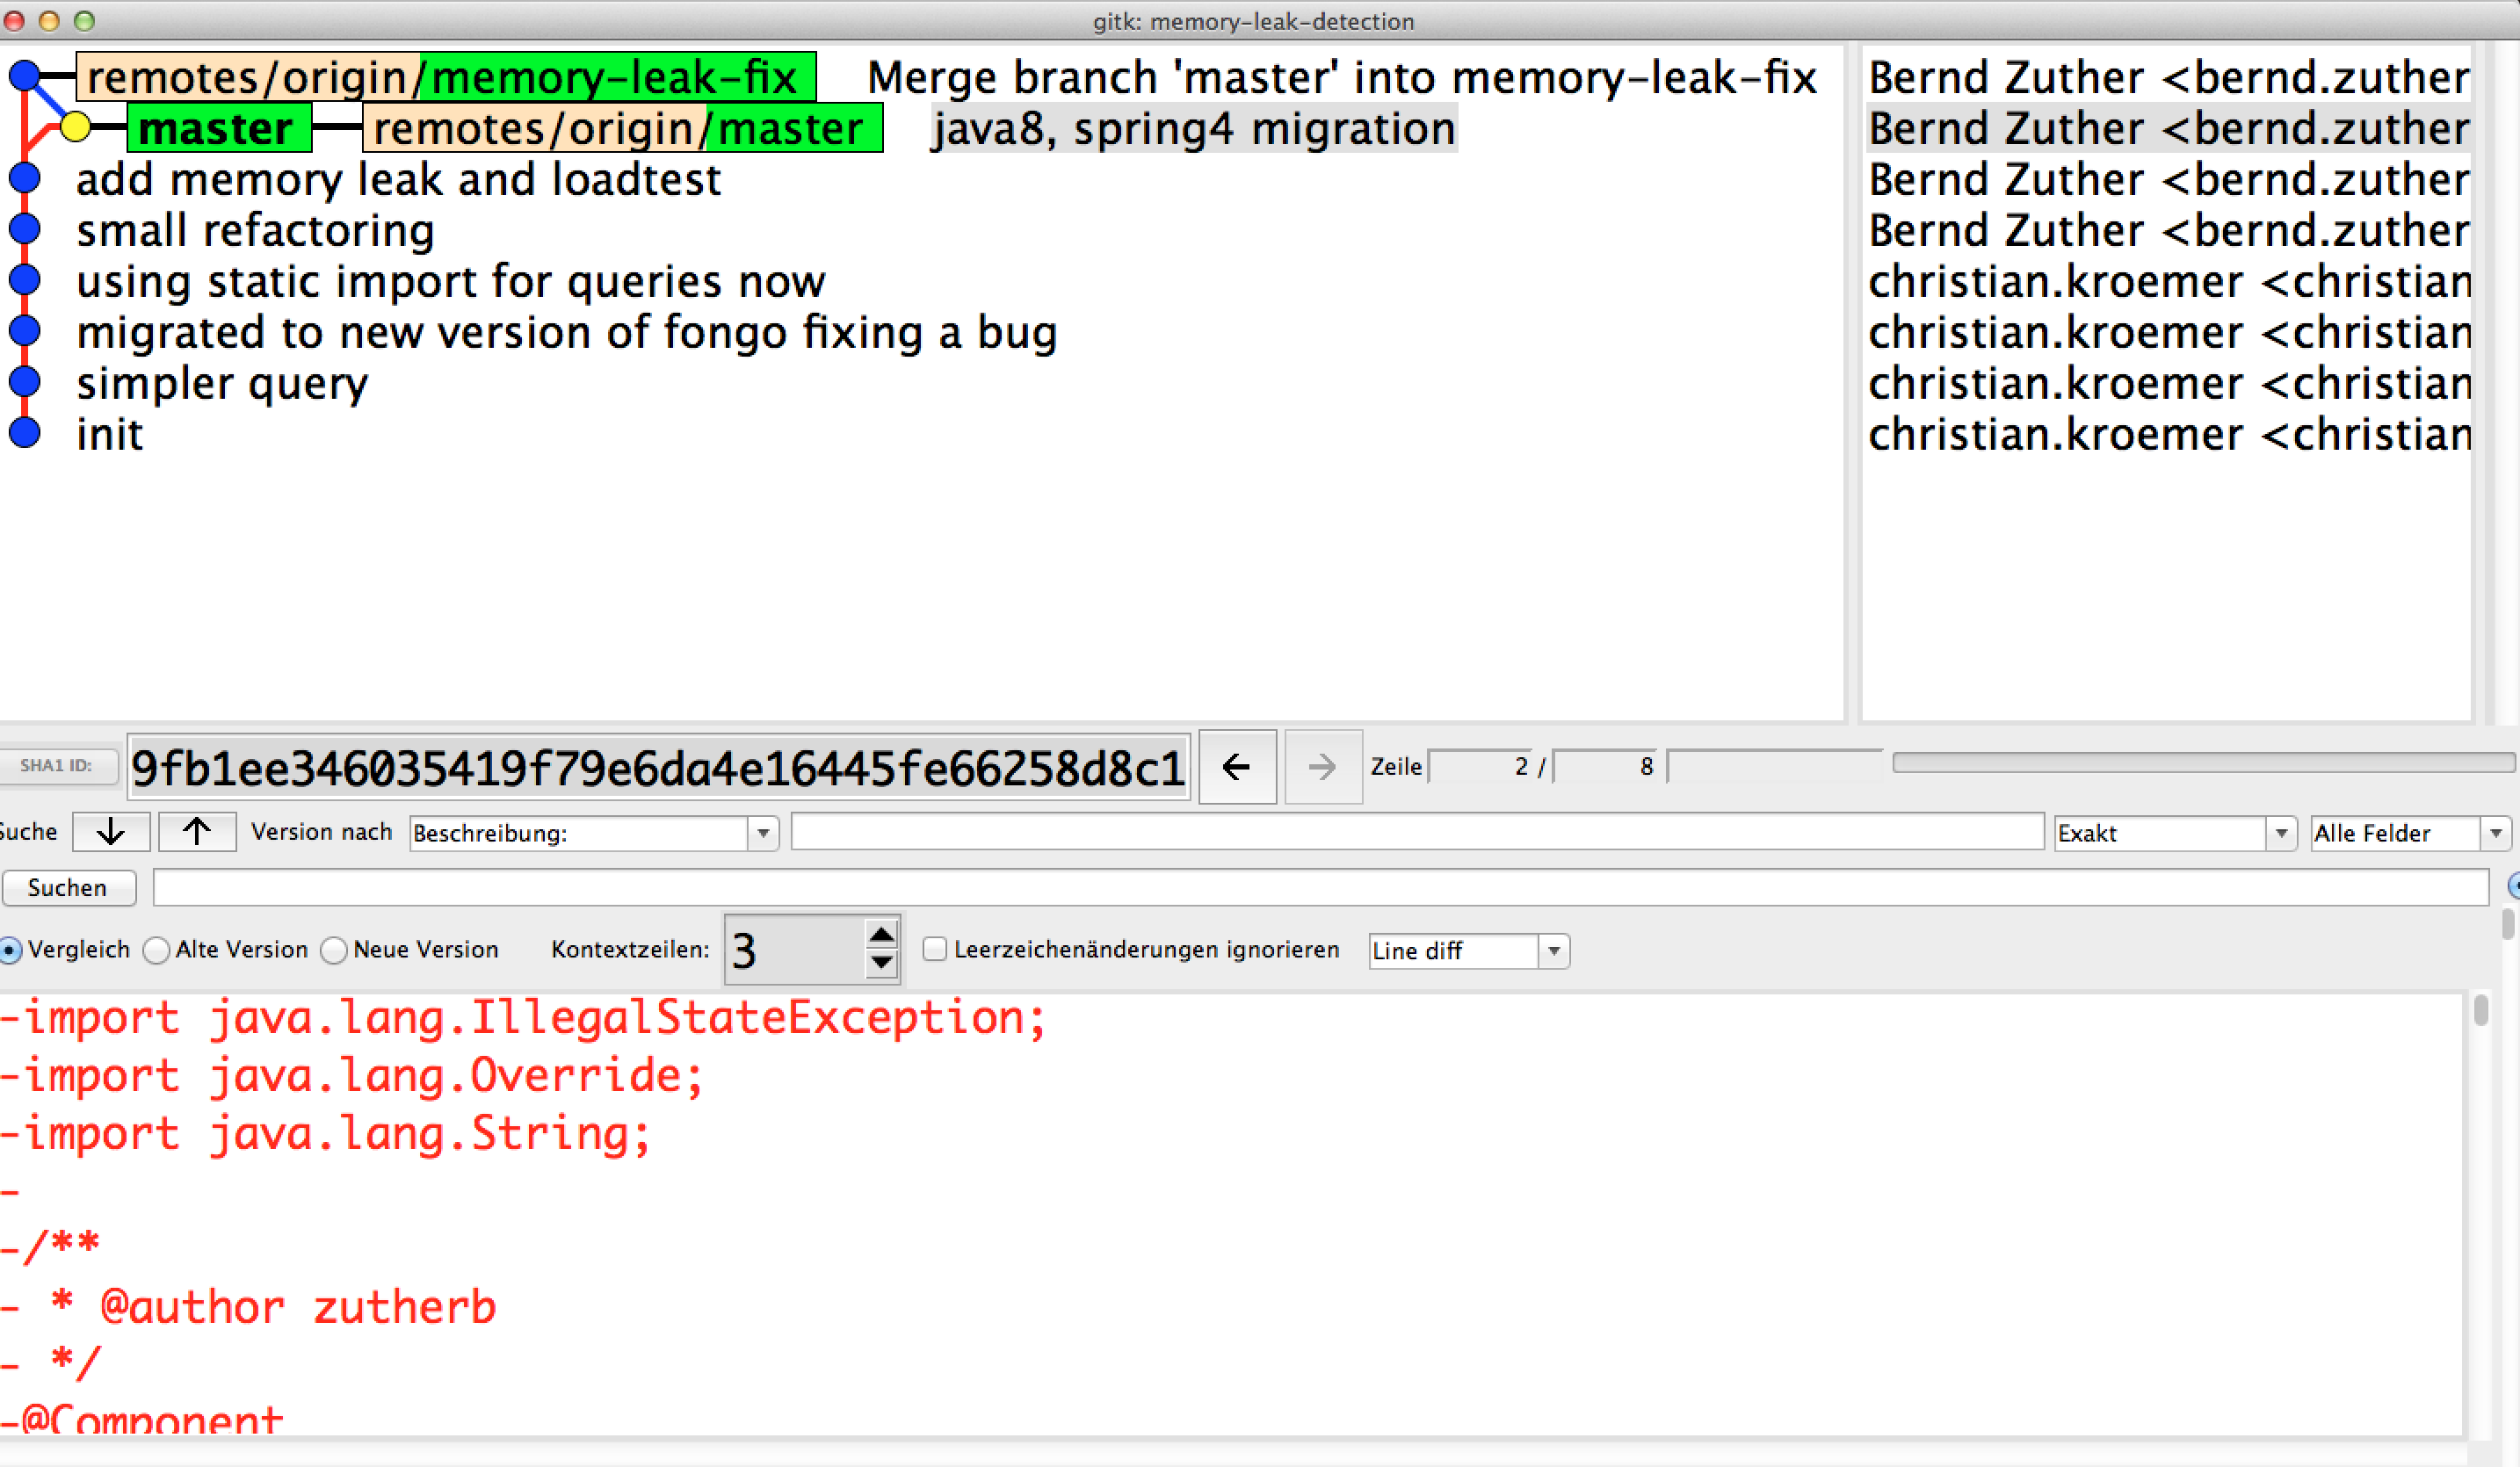
Now that we know the structure of the repository, we can get familiar with the online shop itself. The online shop is based on Java 8. To be able to build and start the online shop, Java 8 therefore also needs to be installed on the machine, and JAVA_HOME must be set as an environment variable accordingly. Gradle is used as the build tool, which is already familiar from the article “Gradle: Creating a Java Application Bundle on Mac OS X”. Gradle is a build-management automation tool based on Groovy and Java, comparable to Apache Ant and Apache Maven. Unlike Maven and Ant, however, Gradle uses a Groovy-based domain-specific language (DSL) to describe the projects to be built. Gradle doesn’t need to be installed on the machine — you can use the so-called Gradle wrapper, located in the project’s root directory, to build the project and start the application. For this, we use the jettyRun task in the shop/ui project. After a while, the online shop starts up at the URL http://localhost:8080/pizza. The following listing shows how to set JAVA_HOME for Java 8 on macOS (PREREQUISITE: Java 8 is installed) and start the online shop:
bernd@mbp ~/mld $ export JAVA_HOME="${/usr/libexec/java_home -v 1.8}"
bernd@mbp ~/mld (master)$ ./gradlew -p shop/ui/ jettyRun
The catalog page of the online shop has a memory leak built in. It manifests as an OutOfMemoryError: Java Heap Space if you load the catalog page often enough. So you don’t have to keep calling the catalog page http://localhost:8080/pizza/productcatalog/pizza by hand, the file loadtest.jmx is located in the external directory. This file can be run with the program Apache JMeter. JMeter is a free tool written in Java for running load tests against client/server applications. JMeter lets you assemble a test plan that specifies which parts of the application should be exercised, in order to get concrete results about response-time behavior.
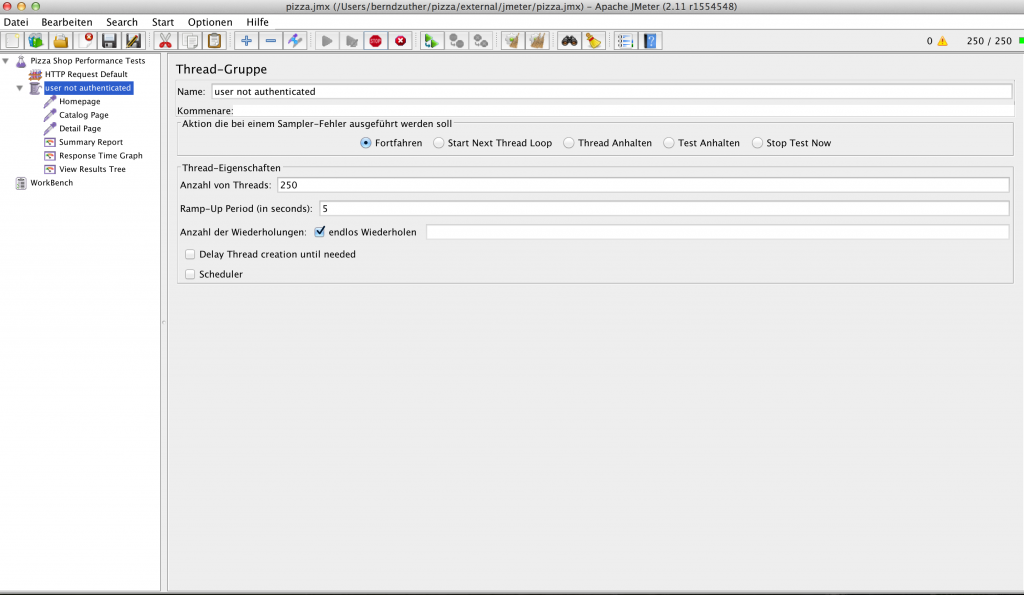
Let’s open JMeter and run the loadtest.jmx file against the running shop by clicking the green play button below the menu list in JMeter. After a while, an OutOfMemoryError: Java heap space occurs.
Error for /pizza/productcatalog/pizza
java.lang.OutOfMemoryError: Java heap space
Now we’ve reached the moment where we need to create a heap dump. The following listing shows how we can use jps to find the process ID of the running online shop, so we can create a heap dump. You should make the first jps call before starting the online shop with Gradle. Usually, though, the highest process ID among the GradleDaemon processes is also the process ID of the running online shop.
bernd@mbp ~/memory-leak-detection (master)$ jps
6097
535 WrapperSimpleApp
4509 GradleDaemon
6404 Jps
bernd@mbp ~/memory-leak-detection (master)$ jps
6097
535 WrapperSimpleApp
6451 GradleDaemon
4509 GradleDaemon
6481 Jps
6441 GradleWrapperMain
bernd@mbp ~/memory-leak-detection (master)$ jmap -dump:live,format=b,file=dump.hprof 6451
Dumping heap to /Users/berndzuther/memory-leak-detection/dump.hprof ...
Heap dump file created
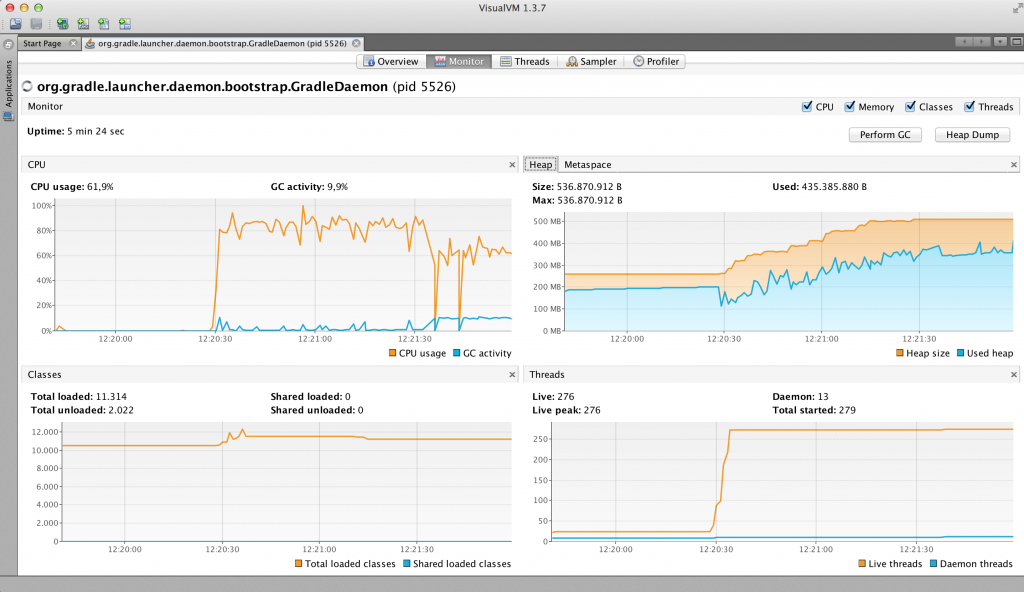
Of course, you can also monitor the online shop with VisualVM during the load test. That lets you watch the heap memory fill up, as shown in Figure 13.
If we now load the dump into the Memory Analyzer and generate a Suspect Report, the Memory Analyzer warns us of a potential memory leak in the ProductCatalogPage class.
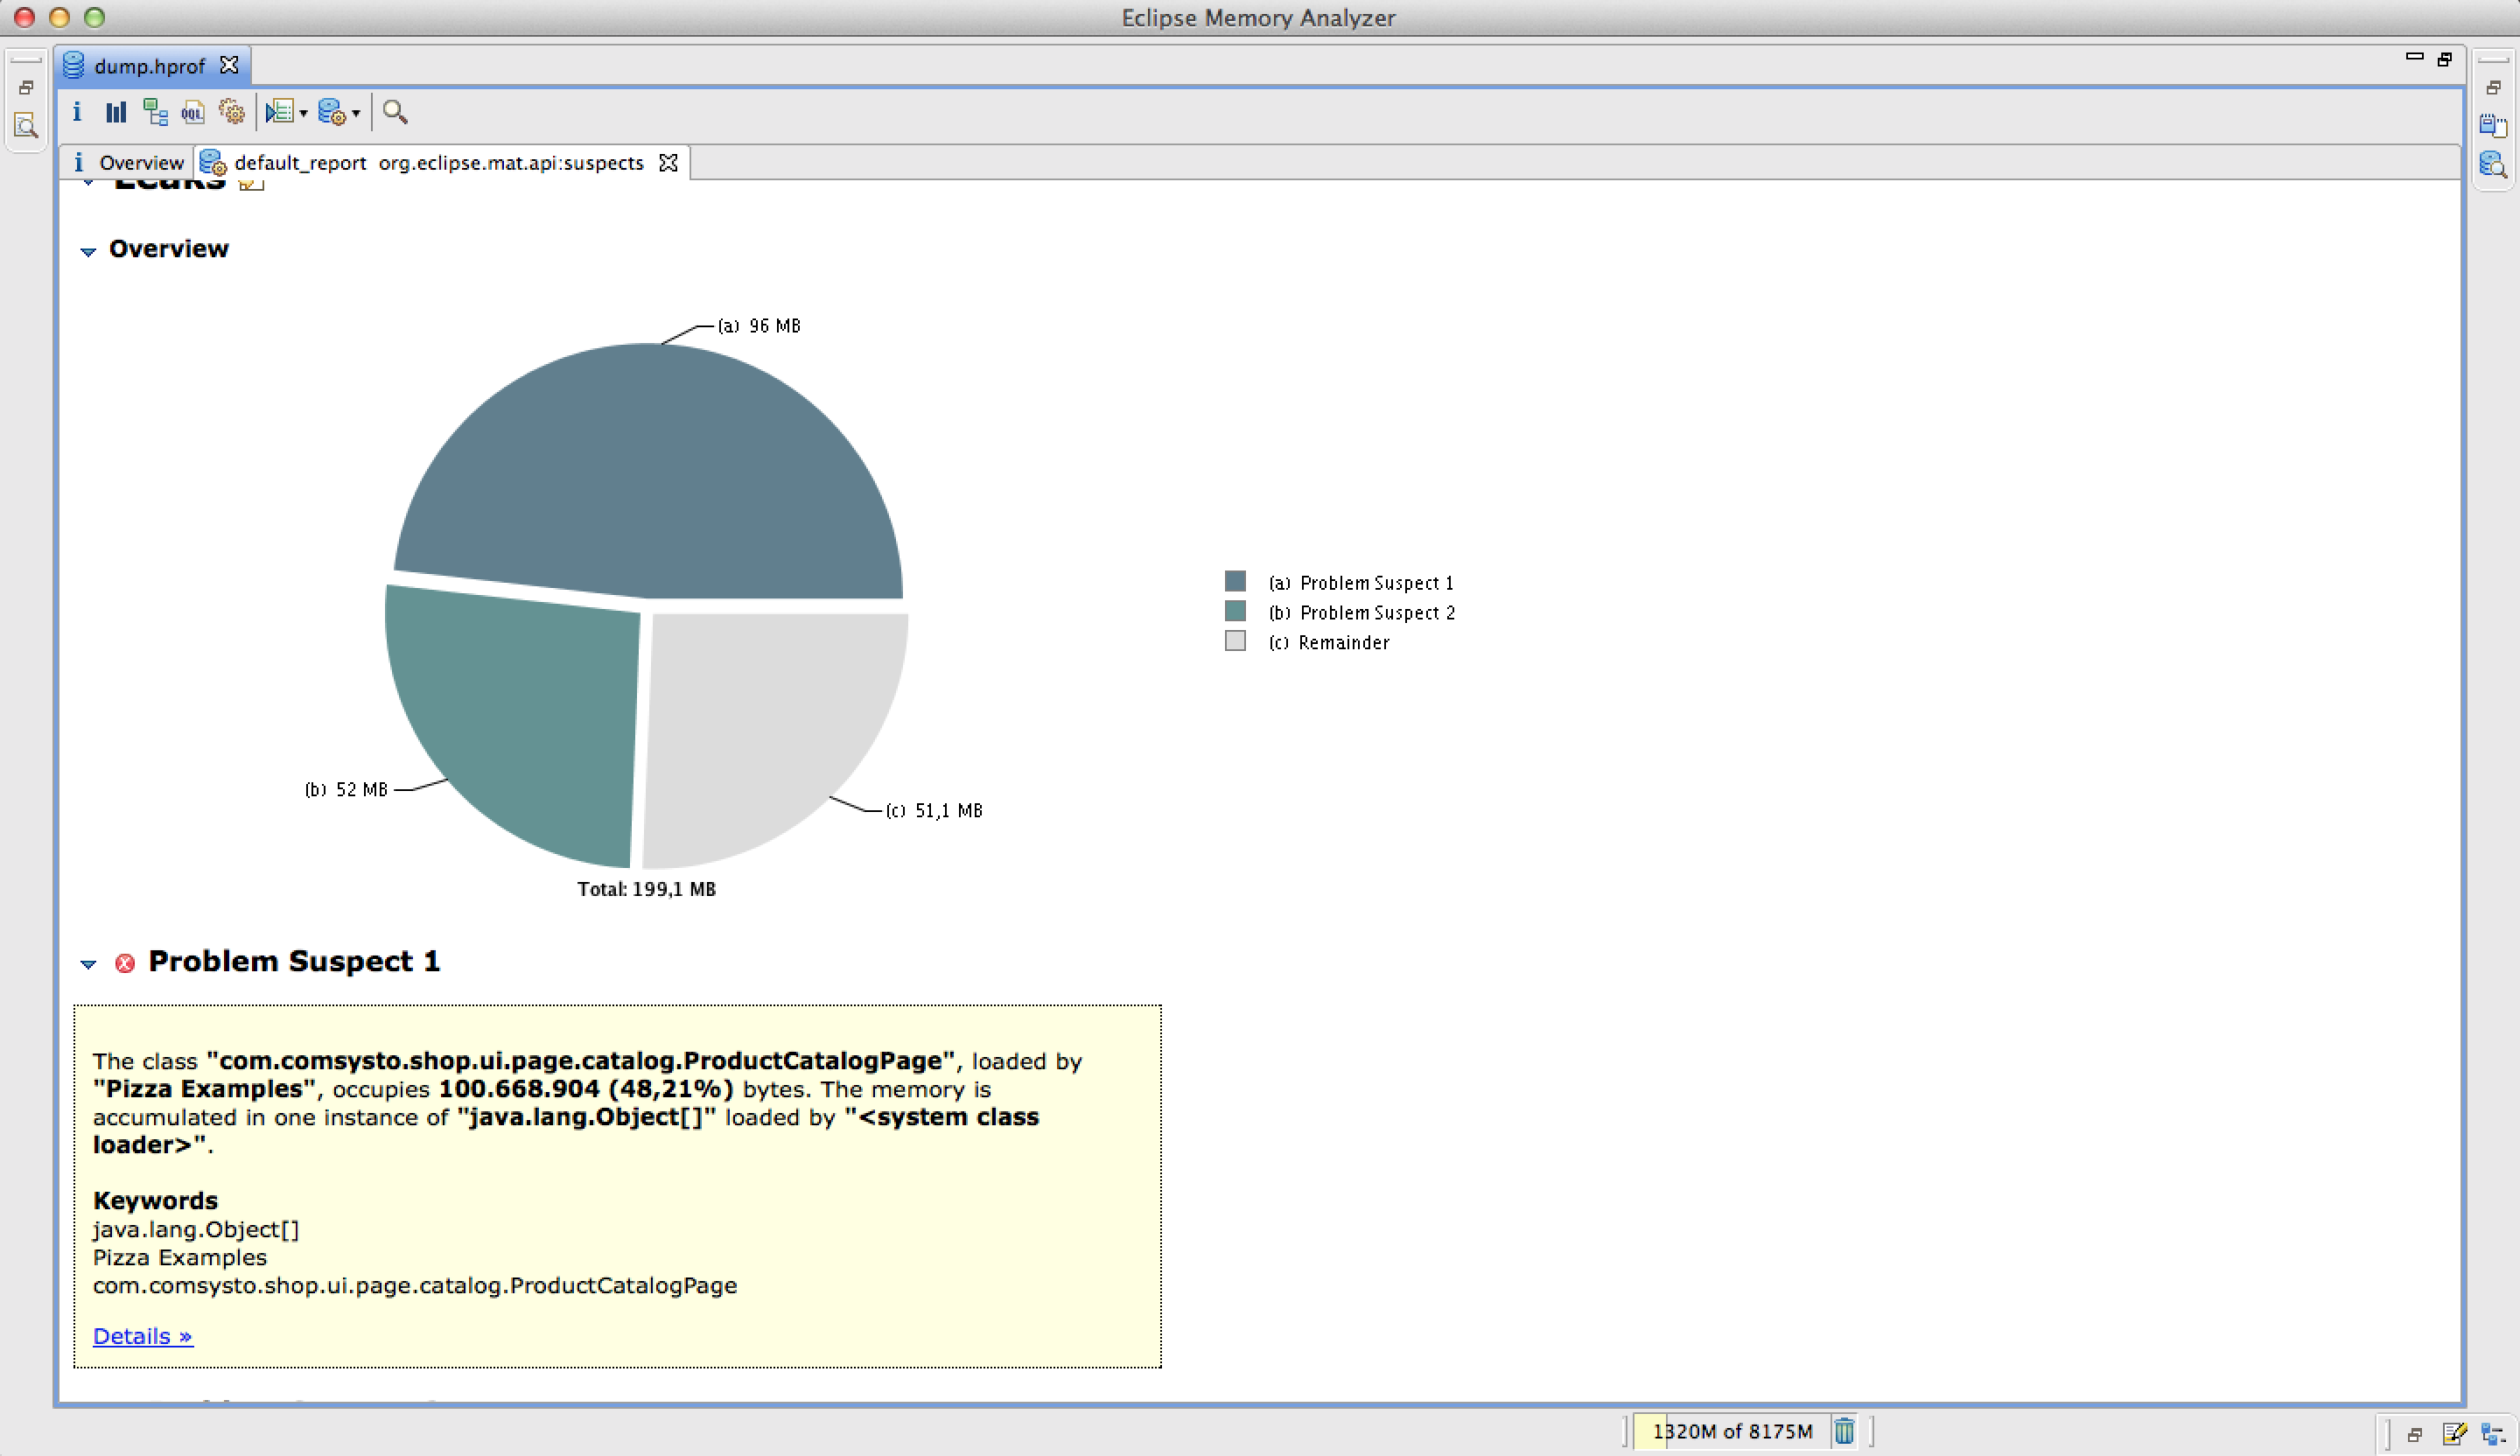
In our example, an ArrayList is presented as the main suspect. This suspicious object consumes roughly half of the memory available to the application. Next, you can bring up a detailed description by clicking on Details. In this view, you can see what the suspicious ArrayList contains and who references the ArrayList. This information is also nicely laid out in the Memory Analyzer:
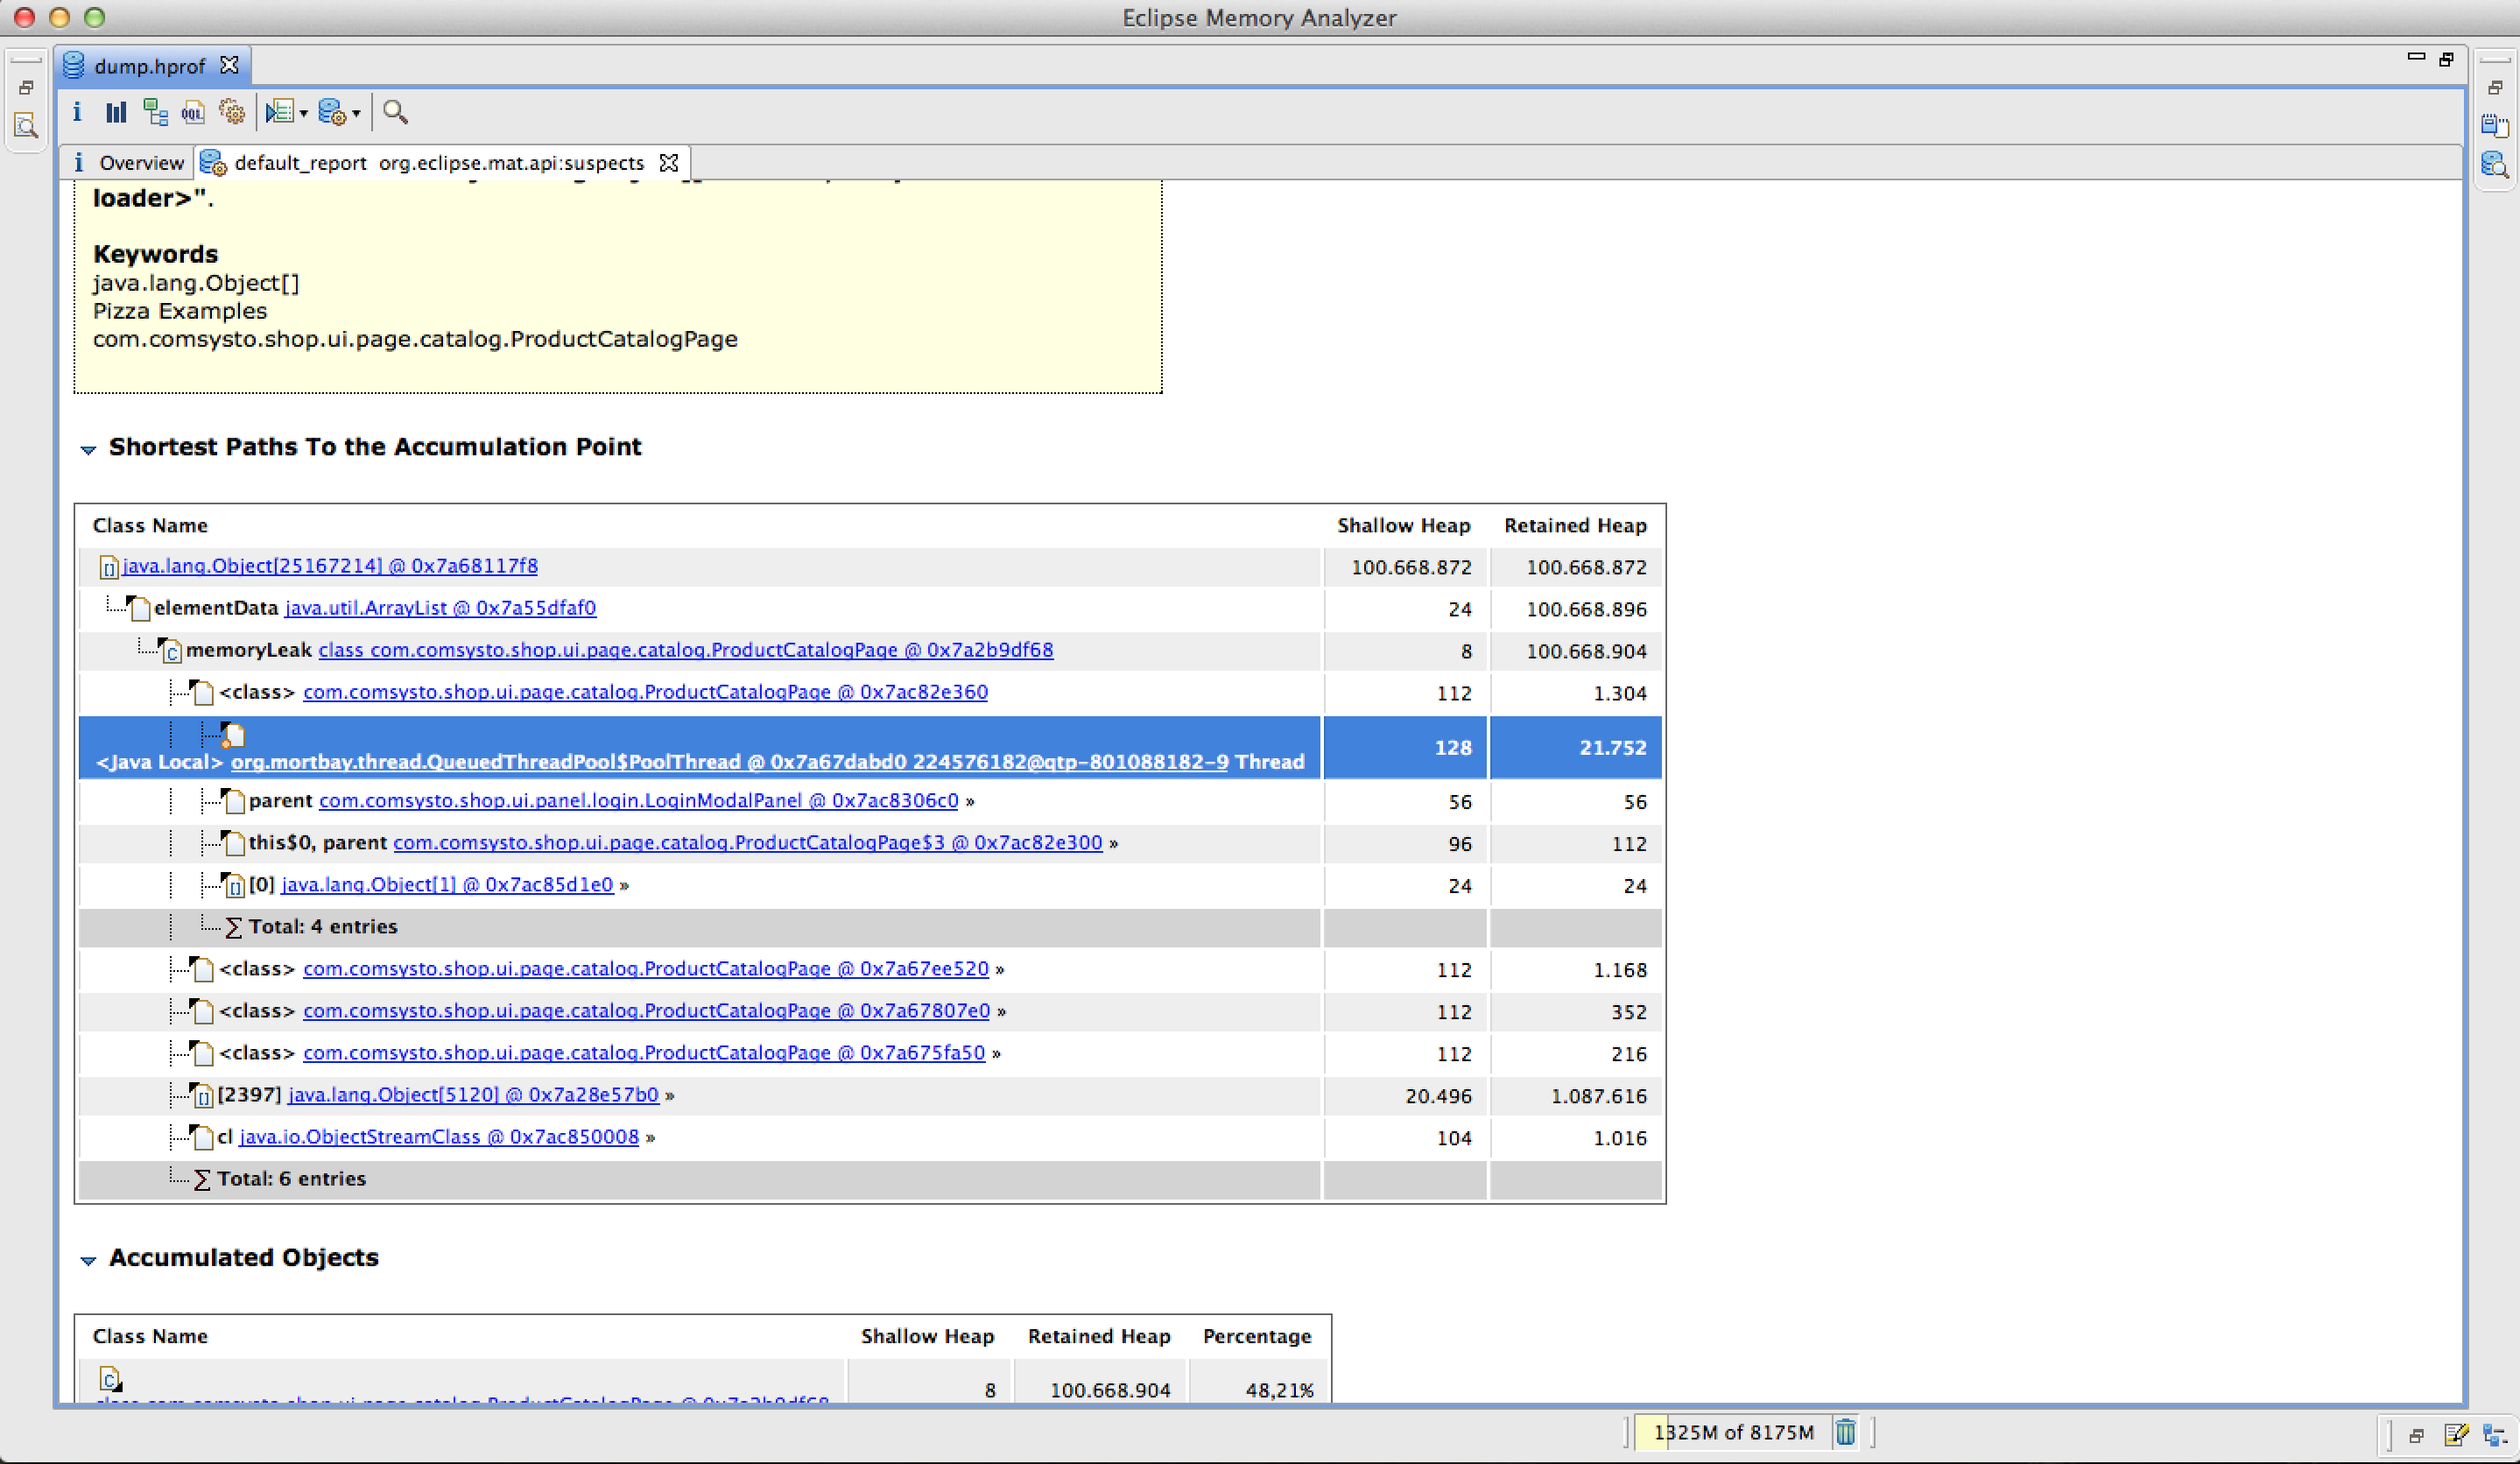
In the Accumulation Point view of the Suspect Report, we can see that the ProductCatalogPage class contains a variable called memoryLeak that references the suspicious ArrayList. A look at the source code reveals that this is a static variable that, every time the product catalog is rendered, keeps adding all the elements of the catalog to itself and then copies itself into itself again. If you remove the list, you can run the load test without hitting an OutOfMemoryError. With that, we’ve found and fixed the memory leak in the application.
@MountPath("productcatalog/${type}")
@EnumProductTypeNavigationItem(enumClazz = ProductType.class, defaultEnum = "PIZZA", sortOrder = 2)
public class ProductCatalogPage extends AbstractBasePage {

    @SpringBean(name = "productService")
    private ProductService productService;

    private IModel productTypeModel;
    private IModel productListModel;
    private Component basketPanel;

    private static List memoryLeak = new ArrayList();
    ...
    private Component productView() {
        return new DataView("products", productDataProvider()) {

            @Override
            protected void populateItem(final Item item) {
                memoryLeak.add(item.getModelObject());
                memoryLeak.addAll(new ArrayList<>(memoryLeak));
                ...
            }
        };
    }
    ...
}
The dominator tree view, shown in Figure 15, also reveals that the ArrayList is a potential candidate for a memory leak.

Summary
In this article, we looked at hunting for memory leaks with the help of a heap dump. A heap dump can be created, for example, with the console program jmap, or automatically via a JVM option when the error occurs.
Heap dump analysis is often performed post mortem, after the application has already crashed with an OutOfMemoryError. The freely available Memory Analyzer (MAT) tool can be used for heap dump analysis, and it suggests potential candidates for a memory leak. Very large dominator trees are also very good potential candidates when hunting for memory leaks.
—————————————————-
I’d like to thank Daniel Mitterdorfer for the many suggestions and ideas that went into this article. Daniel Mitterdorfer is a software engineer and member of the Application Performance guild at comSysto GmbH.
Retrospective (2026)
Rereading this twelve years later, I still think jmap and MAT are the right first move for a classic OutOfMemoryError: Java heap space — nothing beats a dominator tree for pinpointing exactly which object graph is eating your heap, and that hasn’t changed. What has changed is that today I rarely get to that step cold; modern APM tools (think continuous profiling, allocation sampling, and cloud-native memory dashboards) usually flag the suspect class and the growth trend long before anyone needs to pull a manual dump, turning this postmortem workflow into a confirmation step rather than the whole investigation. The discipline this incident taught me — don’t guess, reproduce the load, get the evidence, follow the references to the root cause — is exactly the loop I now build into AI-agent-driven incident response: the agent still needs to gather a “heap dump equivalent” of structured evidence before proposing a fix, instead of pattern-matching a plausible-sounding cause. If I were debugging this shop today, I’d still reach for MAT the moment the APM graph told me where to look.